
Time Chart Examples Gallery
Each use case example in this gallery details the following:
The sample input data for the given scenario
The query needed to create the time chart
A description of the output visualization
The steps required to configure the chart
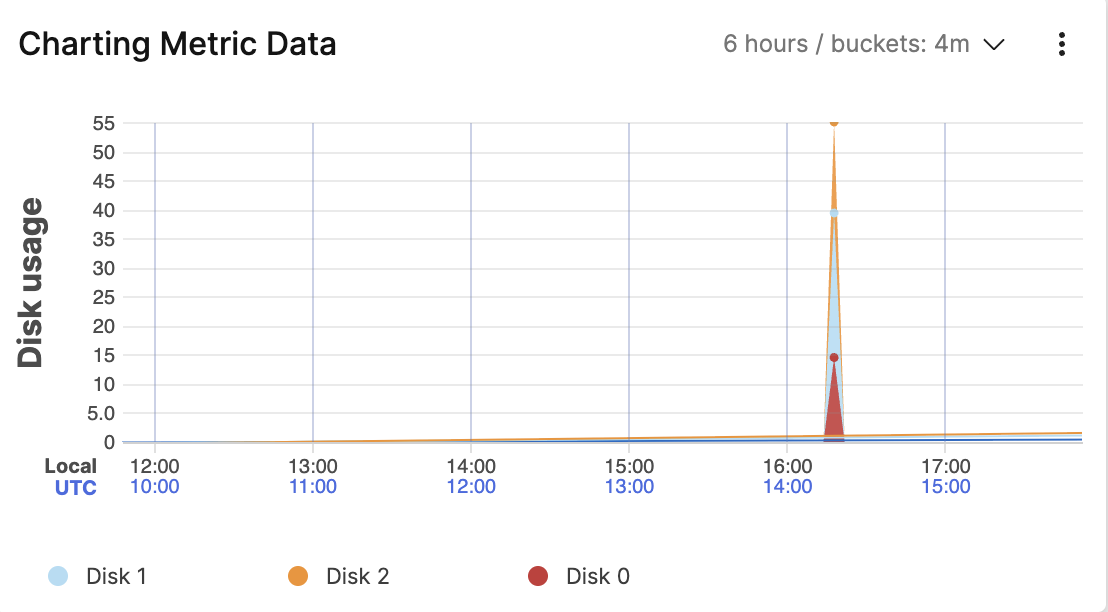 Charting Metric Data — Displays
disk utilization metrics over time using stacked areas.
Charting Metric Data — Displays
disk utilization metrics over time using stacked areas.
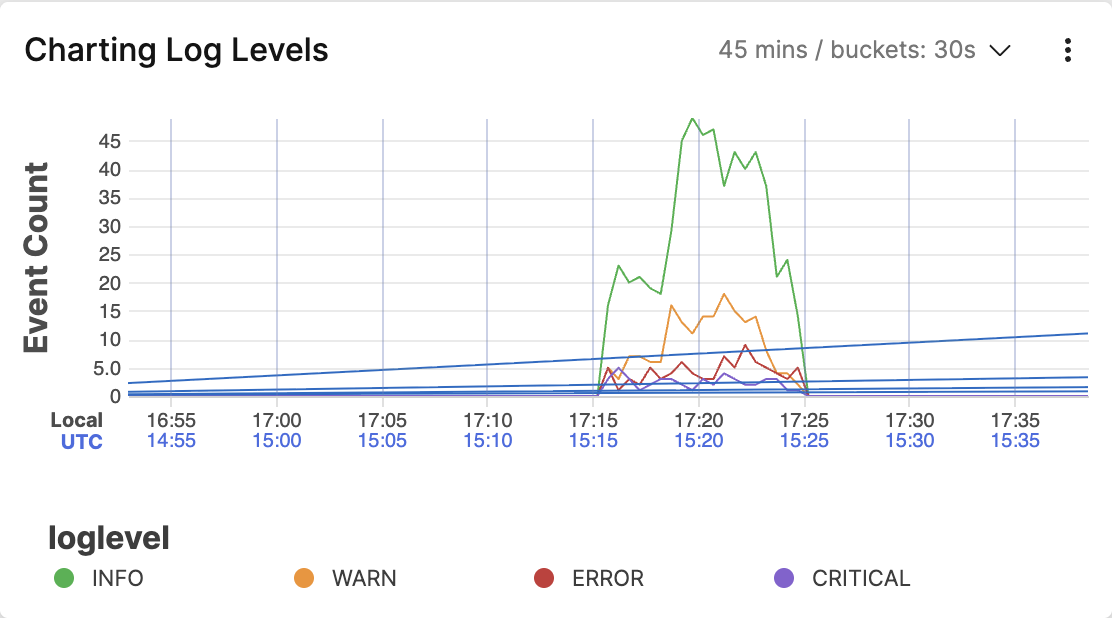 Charting Log Levels — Shows log
levels as separate series to track error patterns.
Charting Log Levels — Shows log
levels as separate series to track error patterns.
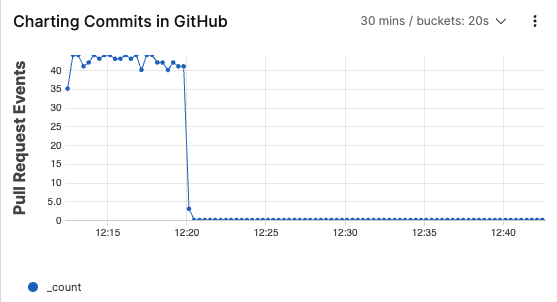 Charting Commits in GitHub — Tracks
GitHub pull request activity to monitor repository velocity.
Charting Commits in GitHub — Tracks
GitHub pull request activity to monitor repository velocity.
Click the title links on each card for step-by-step guidance on how to create these time charts.