
Customize Dashboards
Security Requirements and Controls
Update Dashboardspermission
You can customize a dashboard by changing colors, assigning labels, or adjusting time settings.
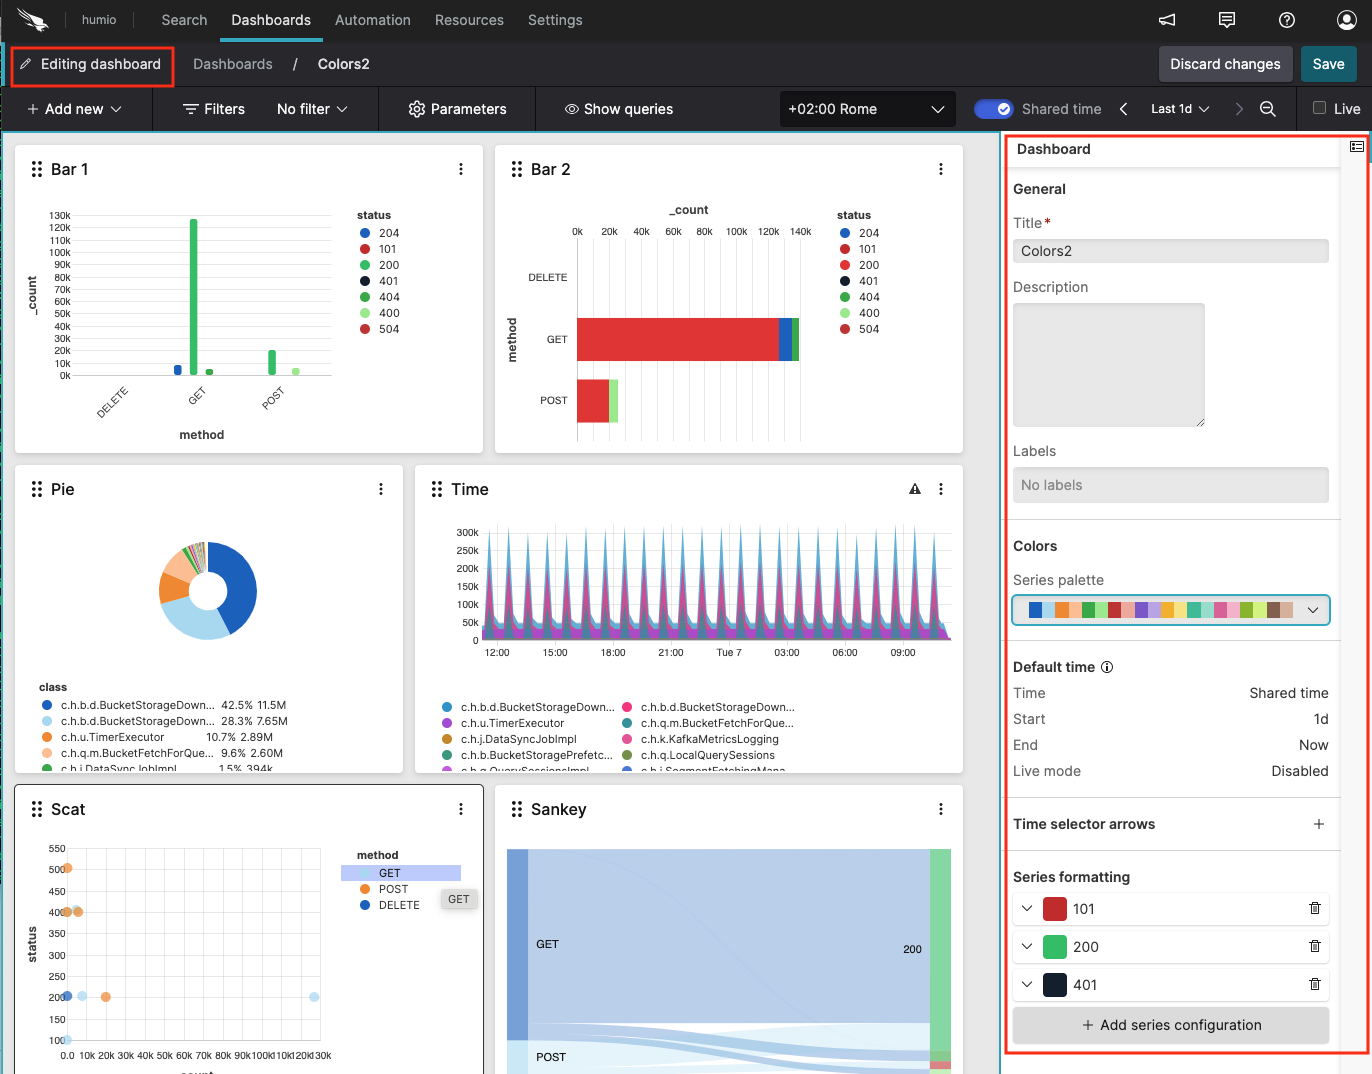 |
Figure 164. Dashboard Edit
Click the Edit icon to enter Editing dashboard mode: this allows you to resize your widget, or drag and move it next to other widgets in the dashboard.
Change the following properties in the side panel as required.
General you can change the name of the dashboard, add a description and assign labels.
Colors offers a default and other predefined color palettes to differentiate dashboard series.
Default time — shows the current default time selection. To update the default, adjust the time setting and save the dashboard. You will be prompted to confirm the change. See Default Time Settings for Dashboards for more information.
Time selector arrows — click to customize the skip interval used when moving the interval earlier or later in time with the and buttons. Click to use the default skip interval.
Time skip — field to enter the customized jump size (in milliseconds).
Series — enables to configure settings for a series across all widgets in a dashboard. Click , type or select from dropdown the field name, then define title and color for the series: the configuration will apply to all widgets on the dashboard. Series configured at widget level will overwrite any dashboard series.
Once you are happy with editing the dashboards and widgets click , otherwise .
Other dashboard properties that are available when in edit mode:
+ Add new — can be used to add a new widget, a new Note Widget, a new
Parameter Panelor a new section to the dashboard.Show Queries — displays the queries used by each widget so that you may edit the query or, if the results aren't quite right for a widget, you might want to copy a particular query, switch to the Search page and paste it in the query input box there so that you can modify it. You can also click the ⋮ menu on a widget and select Edit in Search view, as explained in Widgets.