


IP-Based Geographic Distribution
In this scenario, security teams can monitor outbound connections to identify:
Unusual connection destinations
Data exfiltration patterns
Geographic distribution of network traffic
Sample input data. Here is example input data for this scenario:
| bytes_transferred | destination_ip | event_simpleName | port | source_hostname | success | timestamp |
|---|---|---|---|---|---|---|
| 1024 | 203.0.113.45 | NetworkConnection | 443 | WKSTN-001 | 1 | 2025-09-23T10:15:22Z |
| 2048 | 198.51.100.23 | NetworkConnection | 80 | WKSTN-002 | 1 | 2025-09-23T10:15:23Z |
| 4096 | 192.0.2.178 | NetworkConnection | 443 | WKSTN-003 | 1 | 2025-09-23T10:15:24Z |
| 8192 | 185.220.101.47 | NetworkConnection | 8080 | WKSTN-004 | 1 | 2025-09-23T10:15:25Z |
| 512 | 45.142.212.61 | NetworkConnection | 22 | WKSTN-005 | 1 | 2025-09-23T10:15:26Z |
Query. To create a worldmap, use the following query:
event_simpleName=NetworkConnection destination_ip=*
| !cidr(destination_ip, subnet=["224.0.0.0/4", "10.0.0.0/8", "172.16.0.0/12", "192.168.0.0/16", "127.0.0.0/8", "169.254.0.0/16", "0.0.0.0/32"])
| worldMap(ip=destination_ip, magnitude=count())
Query breakdown:
Filter for events with event_simpleName=
NetworkConnectionthat have a destination_ip field.Exclude internal and reserved IP addresses using the
cidr()function with subnet filters for multicast (224.0.0.0/4), private networks (10.0.0.0/8, 172.16.0.0/12, 192.168.0.0/16), localhost (127.0.0.0/8), link-local (169.254.0.0/16), and unspecified (0.0.0.0/32) addresses.Use the
worldMap()function with theipparameter set to destination_ip andmagnitudeset tocount()to plot connection destinations on the map with connection frequency.
Visualization: The map displays external connection destinations as markers, with darker colors or larger marker sizes indicating higher connection frequency. Hover over points to see country, connection count, and destination details. Zoom in for regional detail to identify specific geographic patterns.
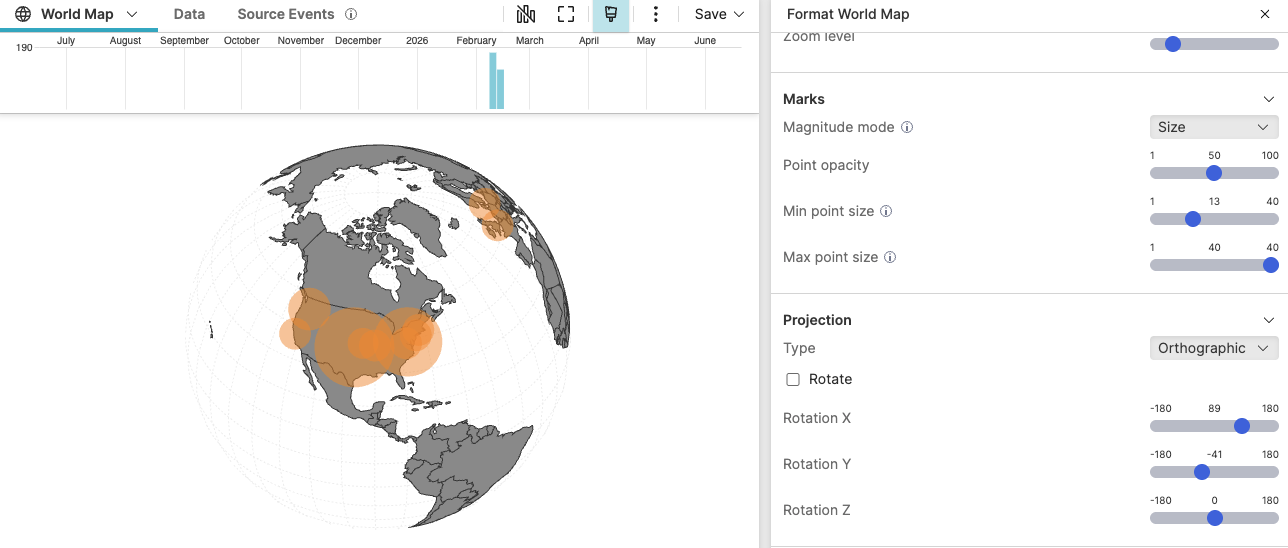 |
Figure 262. IP-Based Geographic Distribution
Configuration:
From the
Searchpage, type your query in the Query Editor → clickChoose in the
Widget SelectorClick the style icon : the side panel shows most settings already configured by default based on the query result.
In Center, adjust the latitude, longitude, and zoom level to focus on your regions of interest for security monitoring.
In Marks, set the magnitude mode to
Sizeto scale marker size based on connection frequency. Configure Min point size and Max point size to make high-frequency destinations visually prominent.Adjust Projection to Orthographic to obtain the map projection type in Figure 262, “IP-Based Geographic Distribution”.
Add a custom Title such as
External Network Connections by
              Geographic Location
.
You can further customize this widget by setting more properties, see World Map Property Reference.