
General Information About Triggers
This content covers fundamental trigger concepts in LogScale, including the differences between static and live queries, the importance of timestamps (@timestamp vs @ingesttimestamp), throttling mechanisms for alert management, and query model configurations. You will learn how these components work together to create effective triggers, with detailed explanations of ingest delays, throttling periods, and best practices for implementing field-based throttling controls.
When getting started with triggers, it is important to familiarize yourself with the concepts of queries, timestamps, throttling, and query models. These concepts influence the type of trigger you need to configure.
Queries in LogScale
To give you more context, LogScale supports two ways of querying data: static queries and live queries. Either you specify a time period for searching through the data that LogScale already has, or you can run a live query to catch events continuously as they enter LogScale.
Static queries are queries that you are used to: you write a query and
LogScale executes it against the data in the defined repositories
for the defined time period. When you execute a static query on the
Search page, you get a result that is not
updated unless you re-run the search. Static queries are also used in
scheduled searches. Alerts use static queries if they need to retry due to
errors or ingest delay.
Live queries work in a substantially different way. When you start a live
query, every subsequent event ingested into LogScale will be sent
to the query, and the query updates its internal state with the event, if
the event is relevant. When a live query starts, it runs a static query to
initialize the query result with previously ingested events matching the
query. After that, the query does not look through the data that is saved
on disk again. When you execute a live query on the
Search page, you get a result that is
constantly updated as new events matching your query enter
LogScale, and as old events no longer match the time window. Live
queries are used in all types of alerts. Most dashboards use live queries.
Note
Live queries run as part of the ingest flow, and influence the ingest delay. Running many live queries or running heavy live queries is discouraged. You can see which queries take a lot of time in the Query Monitor.
A live query uses more memory than a static query, and is therefore best suited to queries that only rarely match events. Live queries are also good when state size is small, such as when you are looking for a single count value. They can access data shortly after it has been processed as part of the ingest flow. Most queries use less CPU when run as repeated static queries, which is how scheduled searches work. Heavy queries and queries relying heavily on plain text or regex searches are better suited as static queries, since there are limits on how much processing can be done in the ingest pipeline. The fastest and least costly way to get the most accurate result depends on both the query and the data.
Timestamps for triggers
Timestamps are important when creating triggers in LogScale. Events in LogScale contain at minimum two timestamps @timestamp and @ingesttimestamp. These fields refer to different timestamps for the incoming event:
@ingesttimestamp represents when the event was stored by LogScale — the default and recommended option, it ensures complete results on full data and guarantees that all events have been ingested. On the other hand, choosing this option implies that the original order of events is not preserved.
@timestamp represents the time when the original event occurred in the producing system — called the event timestamp. For events with an identifiable timestamp, this option runs the query on that specific event time. Alerts using this option are triggered based on immediate but partial results when there are delays in the ingest pipeline.
There is always a delay from the time an event is created until it is available for searching in LogScale. There are two parts to that delay:
Ingest delay outside LogScale: The difference between @ingesttimestamp and @timestamp.
Ingest delay inside LogScale: The difference between when an event is available for searching in LogScale and @ingesttimestamp.
It is possible to run queries in LogScale on either @timestamp or @ingesttimestamp. If you run a query up to "now", there will be no events in the last part of the time window equivalent to the ingest delay, as these events are not yet present in LogScale.
Queries running on @timestamp are subject to ingest delay both inside and outside of LogScale. Queries running on @ingesttimestamp are only subject to ingest delay inside LogScale.
Note
@ingesttimestamp/@timestamp selection is not supported in assets other than alerts. This means that, if, for example, you want to save an @ingesttimestamp alert query as a new dashboard widget, it will be saved with @timestamp.
Which timestamp to use for trigger
Use @timestamp if:
You are aggregating and need to do the calculation over the time when the event occurred, such as calculating the number of login attempts per hour.
You correlate events across different sources to create a timeline of events.
Otherwise, use @ingesttimestamp as such searches are not affected by ingest delay outside LogScale.
Throttling
Throttling is one of the tools you can use to make sure you are not getting too many alerts about the same incident, allowing you to control how often an alert can trigger. For example, when you set up an alert to throttle for one hour (by setting the throttle period to one hour), it means that when the alert triggers, it will not trigger again for an hour, even though the alert query may find newer results. The throttle period can be set along with the other properties when creating a new alert. You can throttle all actions or specify a field to throttle on.
Throttling is only applicable for alerts; it is not available for scheduled searches.
Setting a Throttle period is optional for Filter alerts (because each event matching the query triggers the alert), but it is mandatory for Aggregate alerts and Legacy alerts. In the latter case, setting the throttle period allows you to to prevent the query triggering a configured action too often or too frequently. You will always get one alert for a batch of events, rather than one for each event. For the same reason, in Legacy alerts and Aggregate alerts, the default Throttle period set in the UI matches that of the query time window (which is not relevant for Filter alerts).
There may be times when several events are found in a short period of time that meet the search criteria. You probably do not need to be alerted multiple times in a row. In the example shown, the default throttle setting of once per hour is acceptable.
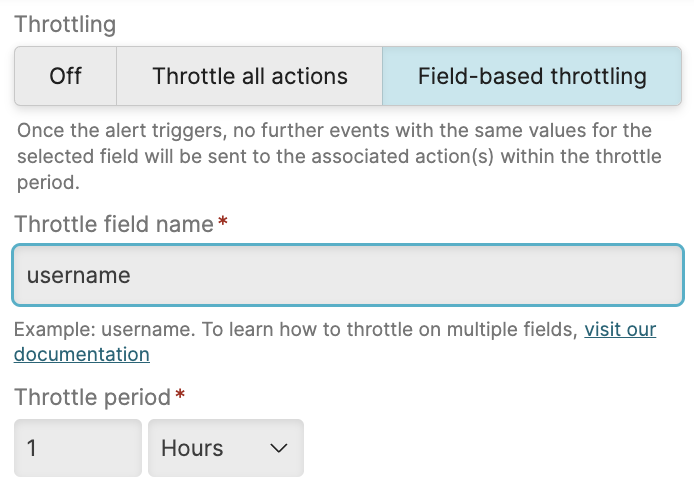 |
Figure 259. Alert Throttling
There are two types of throttling: general throttling and field-based throttling.
General throttling
General throttling means that the alert does not trigger again within the throttle time period at all.
Field-based throttling
When you need to know if an event matching the alert occurs in another environment or for another user, throttling the alert overall would be too generalized, preventing an alert when one is intended. That's when it makes sense to specify one or more fields in the query result to throttle against (such as username). When the alert triggers, it stores all values for the throttle fields together with the trigger time. Then it filters out those values in any future query results, until the throttle period for that value has expired. So you will, for example, only get an email within the same hour, if yet another server is in trouble, or another user ran out of login attempts.
Example
Say you have an alert that triggers when a machine is running out of disk space: you want to throttle further messages for the same machine and you still want to receive a message if another machine also starts running out of disk space within the throttle period. You can decide to throttle on only events with identical field values, and select the field in your logs containing the name of the machine.
This alert searches for a specific log event with a time window of 1 hour and a throttle period of 1 hour. At some point,
machine1runs out of disk space, which results in an event in the log, and the alert triggers on this event. The alert search will continue to run and find this event every time, but it will not trigger the alert, since it is throttled. After some time,machine2also runs out of disk space. The alert search will now find both events, but will only trigger formachine2, sincemachine1is throttled. After an hour, ifmachine1is still out of disk space (and there are newer log events for this), the alert will trigger again formachine1.
The field you throttle on should be in the result of the query, not just in the events that are input to the query. If a result from the query does not contain the field, it will be treated as if it had an empty value for the field.
Best Practices and Limitations
Select a field for which there are not too many different values. For example, @id will never be a good choice, since that is unique per event, so it basically means that no throttling would be applied. The only metadata field that in normal cases does not have too many values is @timezone.
Currently, there is a limit on how many values are stored (defaults to 100), so you should choose a field that does not have more than 100 distinct values within the throttle period. This means that if there are more than 100 distinct values within the throttle period, you will get duplicates before the throttle period expires, and a warning on the alert. If the throttle field assumes more values than this limit, the alert might trigger more frequently than indicated by the given throttle period. When there are more than 100 values within the throttle period, LogScale discards the oldest values and retains at most 100. Values of the throttle field are stored by their @ingesttimestamp for filter alerts, and the end time of the time interval for aggregate alerts.
Use the configuration parameter
AGGREGATE_ALERT_MAX_THROTTLE_FIELD_VALUES_STOREDto set the maximum number of values stored for aggregate alerts,FILTER_ALERT_MAX_THROTTLE_FIELD_VALUES_STOREDto set the maximum number of values stored for filter alerts, orALERT_MAX_THROTTLE_FIELD_VALUES_STOREDto set the maximum number of values stored for legacy alerts.
Throttling on multiple fields
Filter and aggregate alerts can be configured to throttle on multiple fields.
To specify multiple fields in the Throttle field names input field, enter each field name and press Enter to add it. Repeat for each additional field.
Figure 260. Throttling on multiple fields
When you throttle on multiple fields, only events that match the values for all throttle fields from a previous event get throttled.
Example
If you have the throttle fields user and host, and the alert first triggers on an event with user=user1 and host=host1, the alert throttles subsequent events that also have both user=user1 and host=host1. Events with user=user1 and a different host (such as host=host2), or events with host=host1 and a different user (such as user=user2), are not throttled and trigger the alert again.
In other words, matching only some throttle fields (like just user or just host) is not enough — all fields must match for the event to be throttled.
If you need to throttle on multiple fields in Legacy alerts, see Throttling on multiple fields.
Solution for throttling on multiple fields in Legacy alerts
Legacy alerts can only throttle on a single field. If you need to throttle on multiple fields in a legacy/standard alert, you can simply add a new field that concatenates these fields in the alert query.
For example, if your events have a service and a host field, and you want to throttle on the combination of these, you can add a new field in the alert query by adding the following line to it:
| serviceathost := concat([service, host])and then throttle on serviceathost.
Query ownership
You can run the trigger with the permissions of another user or an organization. The Run on behalf of options allow you to select a user as owner or the organization.
Run on behalf of organization. Triggers that use this query model will continue to run even if the user who created it is deleted or the user's permissions change. You can see and edit this field if you have the
Change persistent queries to run on behalf of organizationpermission. See also Organization-Owned Queries.Run on behalf of user runs the trigger on behalf of a specific user (i.e., using their permissions); click this field to get a list of available users, or directly enter the name of the user to run the trigger as. If the user running the trigger is deleted or has their permissions changed, the trigger stops running. You can see and edit this field if you have the
ChangeTriggersToRunAsOtherUserspermission.
If you have permission to edit the trigger, you can always run the query as yourself without any extra permissions.