
Inspect Events
The Search page supports the
Inspect option, which allows detailed examination
of a single event for deeper investigation.
To access this functionality you may either:
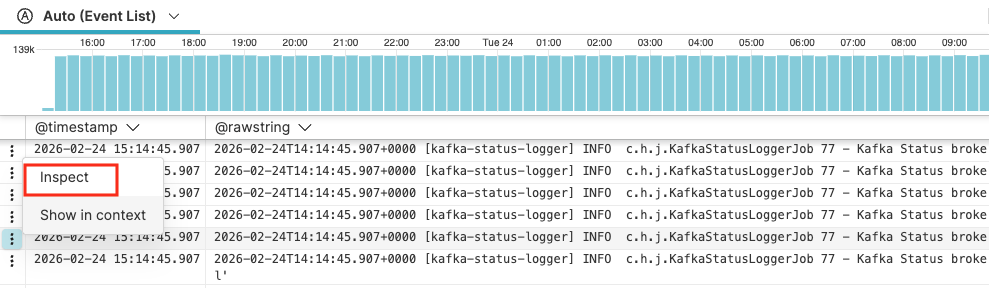 |
Figure 87. Inspect an event
Both methods open the Inspection Panel,
which provides a structured view of all fields and their values within
that specific event. Available views are:
Fields shows all available fields in the selected event and displays both parsed and raw field values. You can select fields by entering field names (case-insensitive) in the filter box, separated by comma.
Message shows the original, unparsed log message that was sent to LogScale. The full message is also available on all events in a special field called @rawstring.
JSON shows the log message in JSON format. It is the same visualization as when you choose the Field Data Types. Click any field under JSON to get some contextual menus, as described at Field Interactions.
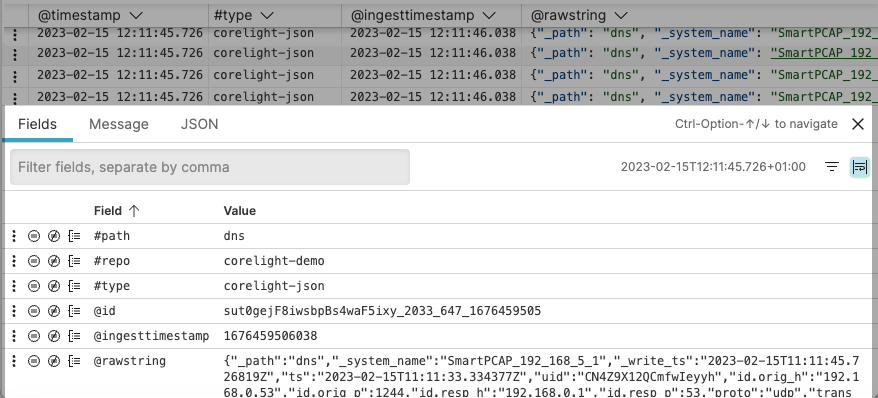 |
Figure 88. Inspection Panel
The small icons next to each field name provide quick access to filtering and grouping options:
Three-dot menu to trigger Field Interactions.
Match value in query
Exclude value in query
Group by value