
Hint: Deselect Series in Widgets
When you have many overlapping series in a widget, it can be difficult to clearly see what is happening for a specific series.
This is especially true for Time Chart
widgets. For example, when you are plotting a high number of clusters,
hosts, or similar metrics that tend to cluster around the same Y-axis
range, the visualization can be crowded:
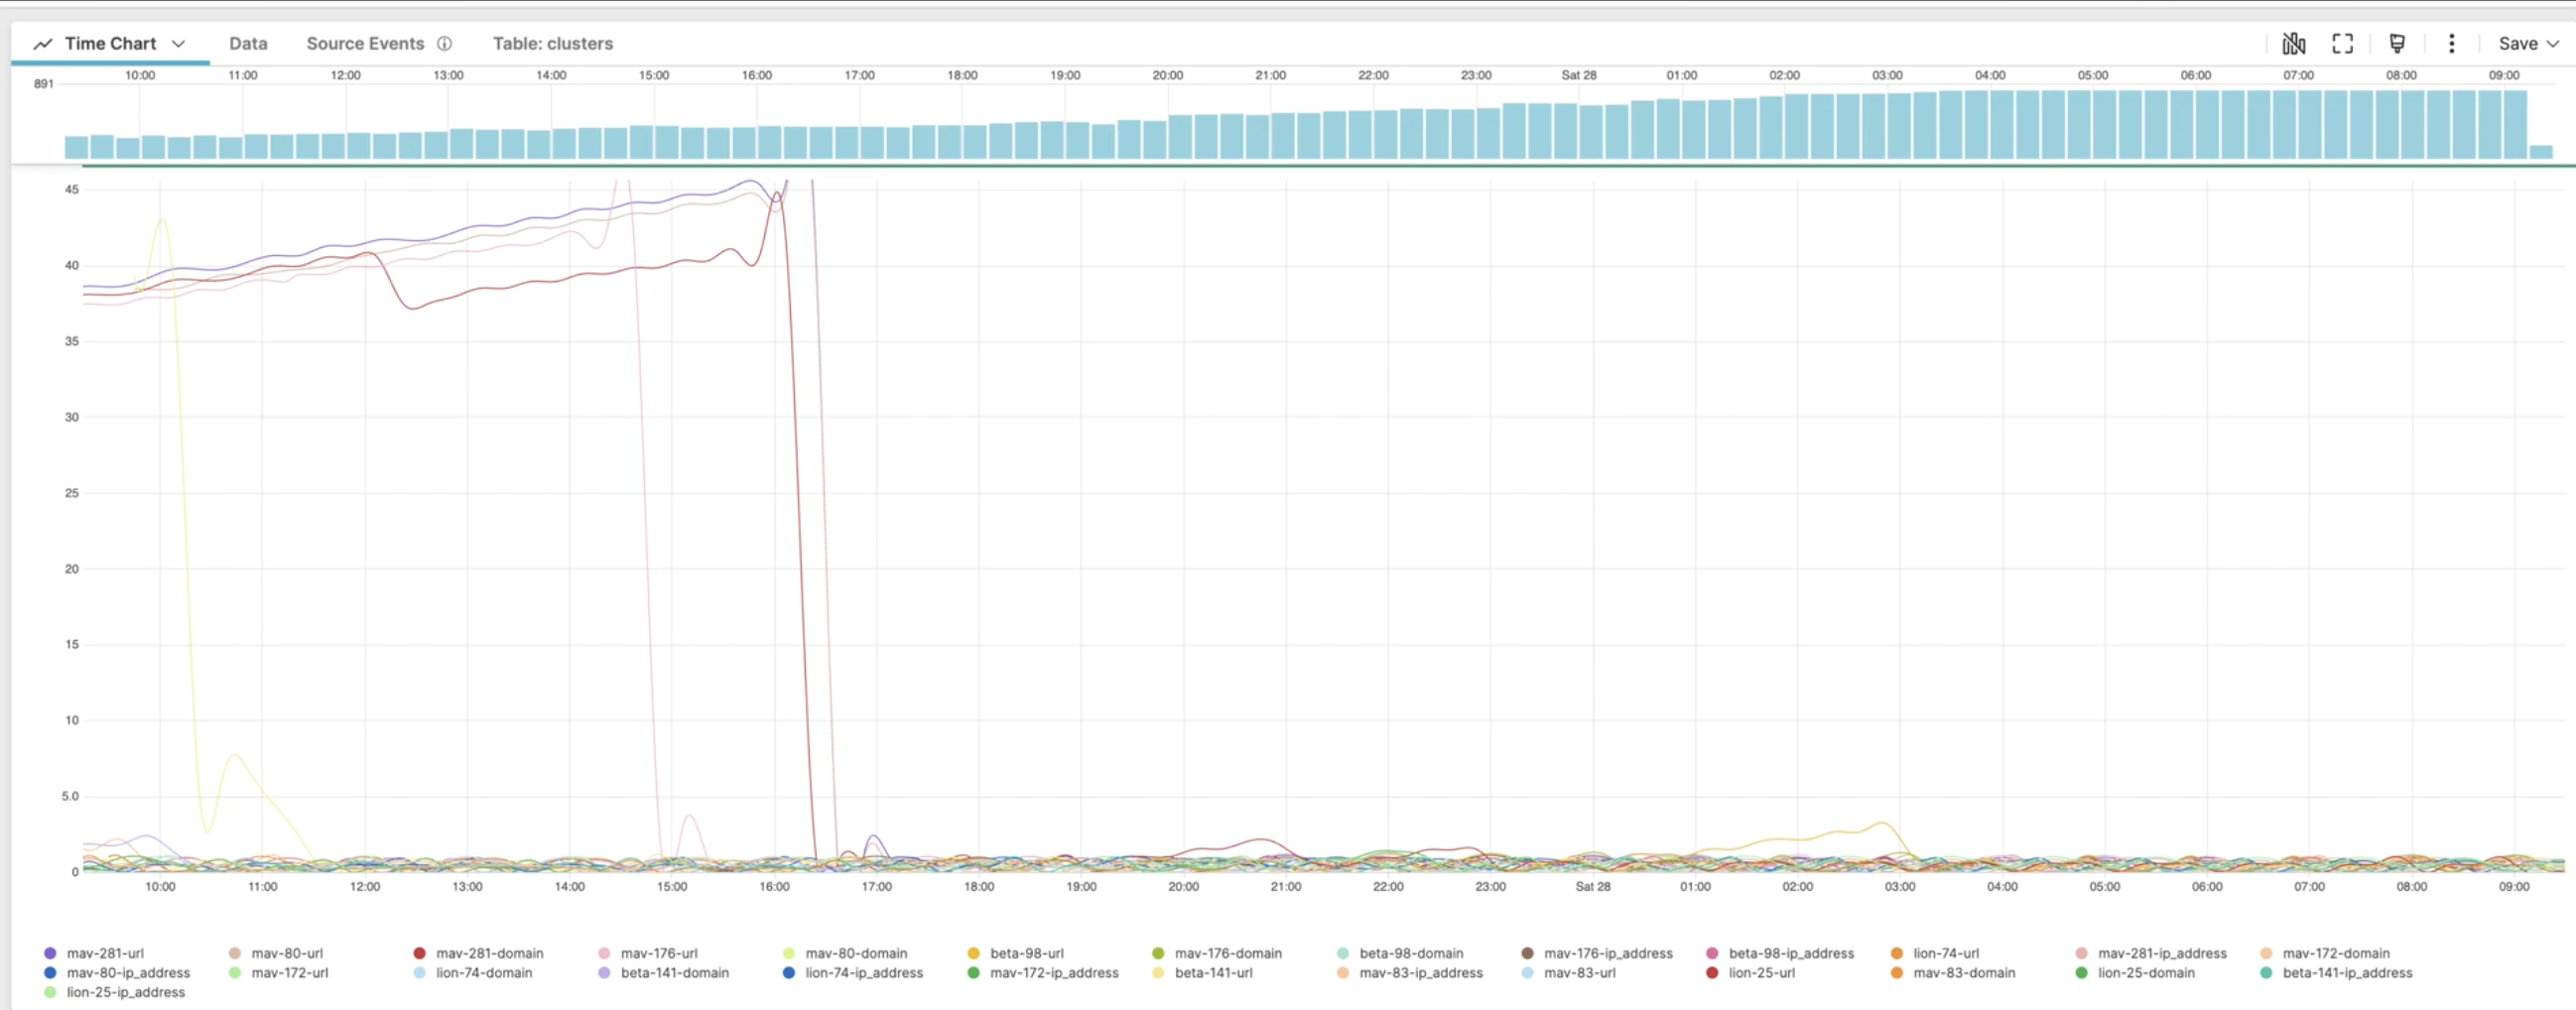 |
Figure 204. Overlapping Series in a Time Chart Widget
To address the need of focusing on one individual series at a time:
Press shift+click on a series item in the chart legend: this will turn off every other series and display that series alone.
Click a second time on the same individual item: this will turn all series back on.
Figure 205. Select and Deselect Series
This shortcut works for other widget types that displays multiple
series, like Bar Chart for example.