
Display Different Statuses
In this scenario, the Table widget
counts events for the different HTTP methods, which have registered
HTTP status errors, like this:
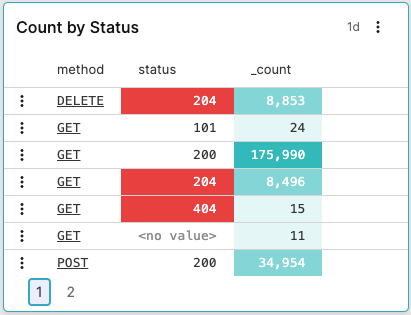 |
Figure 246. Count by Status
From the
Searchtab, type this query in the Query Editor:logscalegroupBy([method, status])A table is created that has fields method, status and _count as its columns.
Save your widget as explained at Create Widgets
Click the menu icon on top-right of the widget and select , the Styling panel is displayed:
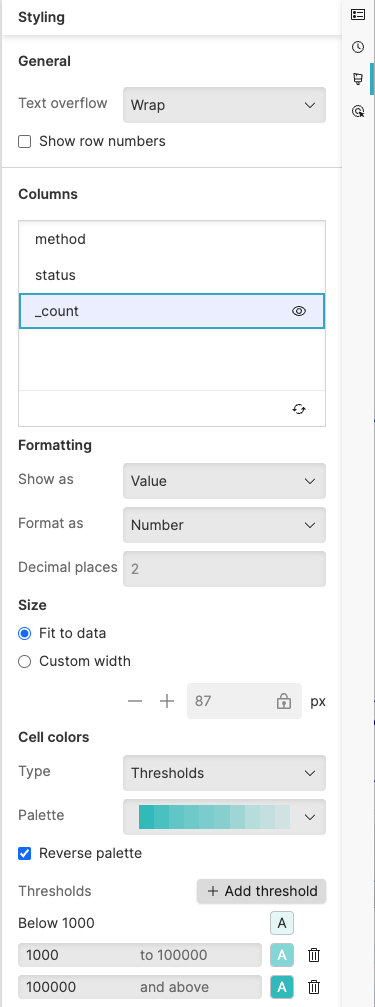
Figure 247. Properties Panel - Example 1
Click the field method in the Columns section and set these properties:
Formatting → Show as : creates links to the Event List for each entry in method , to show the corresponding result (in the example, all results for query
* | method=DELETEwill be displayed).Size →
Cell colors → .
Click the field status in the Columns section and set these properties:
Cell colors → → → color red if the value in the field status contains
04Click the field _count in the Columns section and set these properties:
Cell colors→ → choose a color palette → : different nuances in the palette (light green, dark green, etc.) will highlight the different thresholds (below 1,000, above 100,000, etc.).
For more information on the available properties that you can use to customize your widget, see Table Property Reference.