LogScale Web Interface
Falcon LogScale provides a web-based interface that works with both SaaS (Cloud) and on-premises (Self-Hosted) deployments. LogScale user interface elements provide access to log search, analysis, and management features.
You may see a variety of page layouts as well as common and area-specific user interface elements in LogScale.
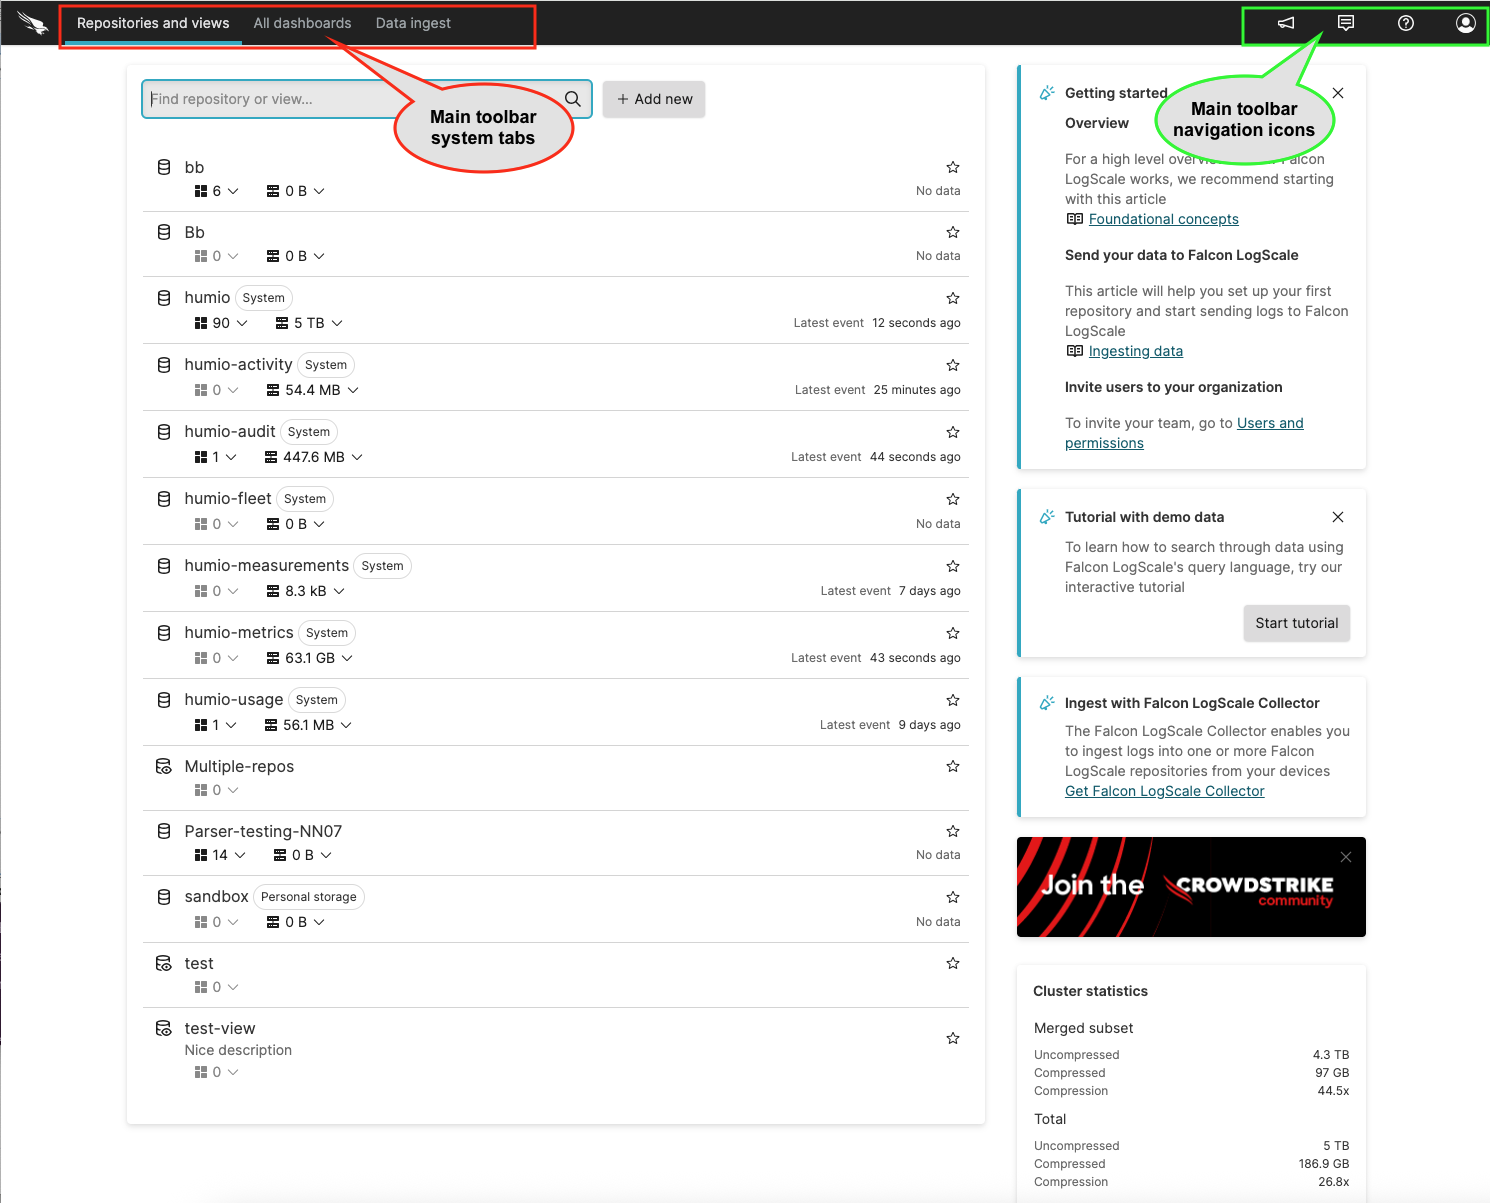
Figure 1. Web interface main toolbar |
| |
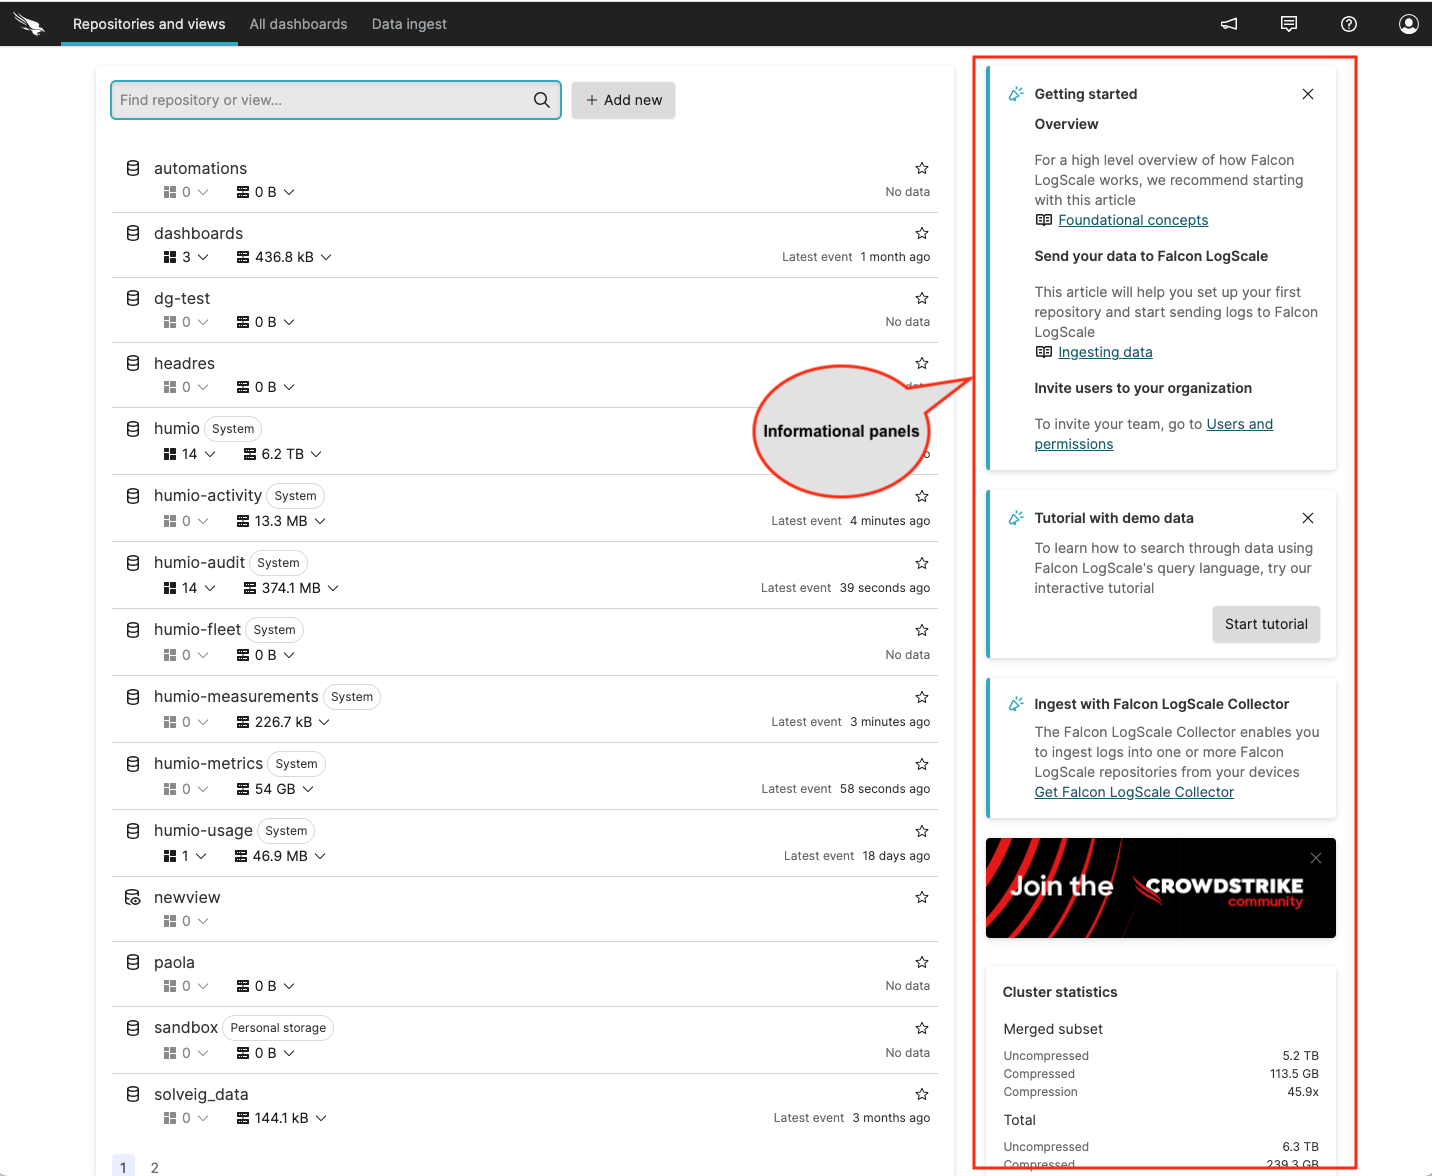
Figure 2. Web interface informational panels | ||
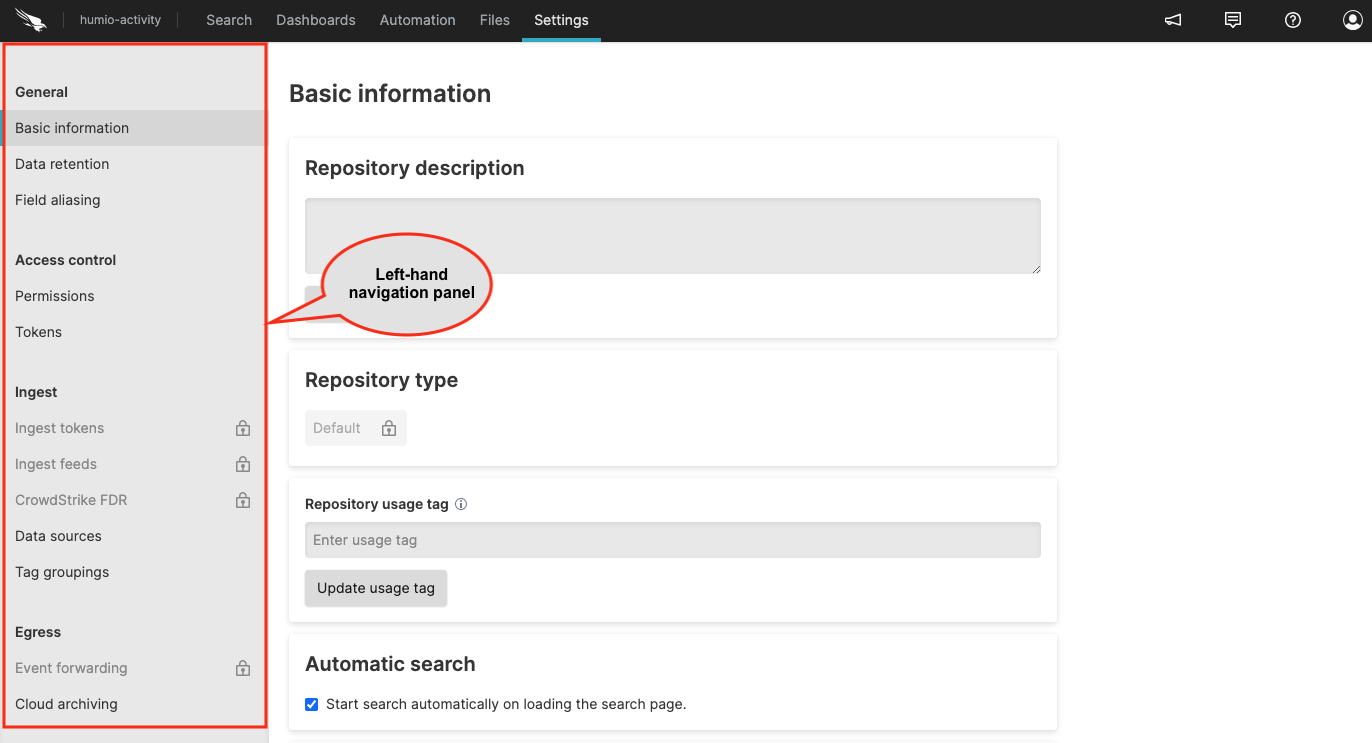
Figure 3. Web interface left-hand panel | ||
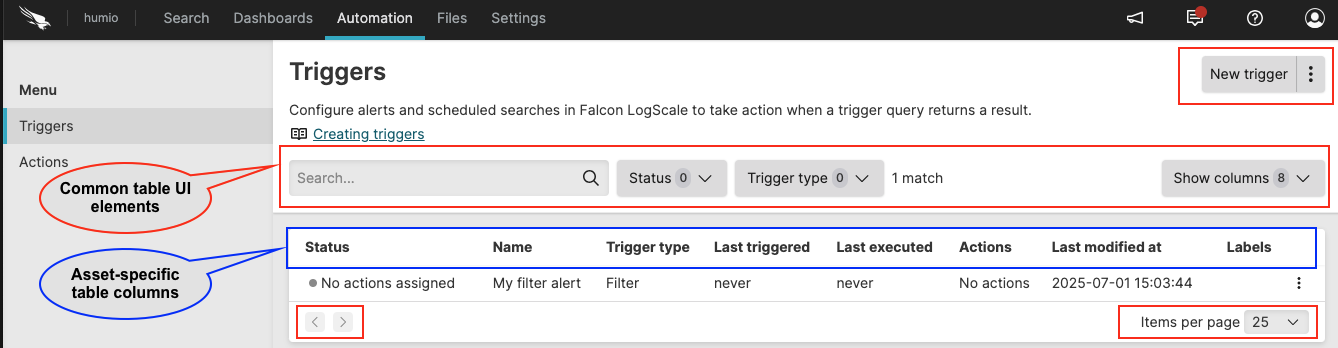
Figure 4. Web interface table component | Table Components |