
Heat Map Examples Gallery
Each use case example in this gallery details the following:
The heat map widget output visualization along with a brief description
The sample input data for the given scenario
The query needed to obtain each heat map chart
The steps required to configure each heat map chart
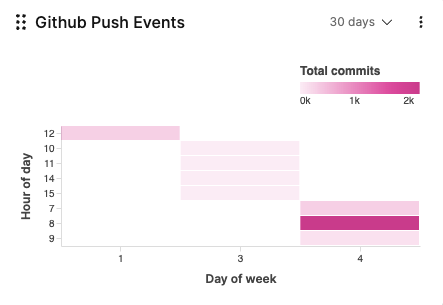 Github Push Events — Heat Map
used to show most activities on Github based on push events over
time.
Github Push Events — Heat Map
used to show most activities on Github based on push events over
time.
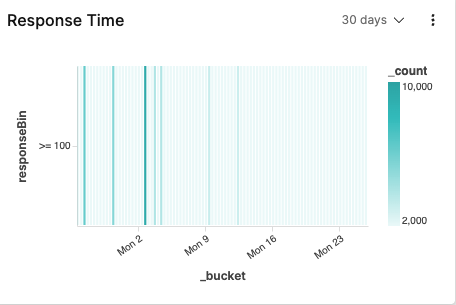 Response Time — Heat Map
used to detect how many events have a certain level of response time
over time.
Response Time — Heat Map
used to detect how many events have a certain level of response time
over time.
Click the title links on each card for step-by-step guidance on how to produce these maps.