
Response Time
Detect how many events have a certain level of response time over time.
Visualization: the heat map displays response time distribution over time, creating a two-dimensional grid where:
X-axis (horizontal) shows chronological progression of response times (in buckets).
Y-axis (vertical) shows categories of response time bins; for example,
<1sindicates excellent response (fastest), whereas<100sindicates very slow response.The cell color and intensity represents the number of events in that response time bin: darker colors for higher number of events, lighter colors for fewer events in that response time bin.
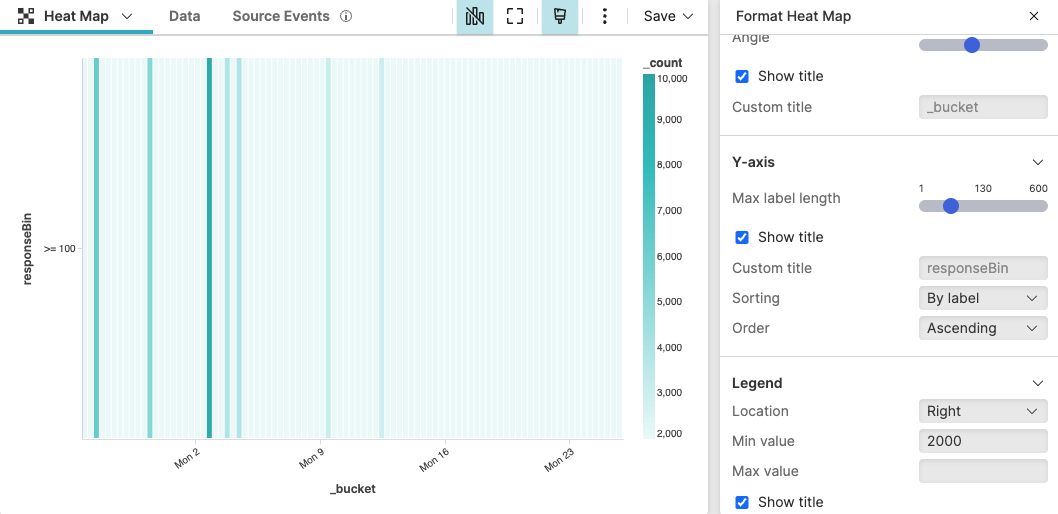 |
Figure 225. Response Time
Sample input data:
| client | endpoint | responseTime | status | timestamp |
|---|---|---|---|---|
| mobile-app | /api/users | 0.8 | 200 | 2025-08-11T09:15:23Z |
| web-app | /api/products | 3.2 | 200 | 2025-08-11T09:15:24Z |
| mobile-app | /api/orders | 7.5 | 200 | 2025-08-11T09:15:25Z |
| web-app | /api/reports | 25.3 | 200 | 2025-08-11T09:15:26Z |
| dashboard | /api/analytics | 82.1 | 200 | 2025-08-11T09:15:27Z |
| web-app | /api/export | 150.6 | 200 | 2025-08-11T09:15:28Z |
| mobile-app | /api/status | 0.5 | 200 | 2025-08-11T09:15:29Z |
| web-app | /api/search | 4.8 | 200 | 2025-08-11T09:15:30Z |
| mobile-app | /api/auth | 9.9 | 200 | 2025-08-11T09:15:31Z |
| system | /api/backup | 120.3 | 200 | 2025-08-11T09:15:32Z |
Query:
case{
responseTime < 1
| responseBin := "< 1"
| responseBinNumber := 1;
responseTime < 5
| responseBin := "< 5"
| responseBinNumber := 2;
responseTime < 10
| responseBin := "< 10"
| responseBinNumber := 3;
responseTime < 50
| responseBin := "< 50"
| responseBinNumber := 4 ;
responseTime < 100
| responseBin := "< 100"
| responseBinNumber := 5;
*
| responseBin := ">= 100"
| responseBinNumber := 6;
}
| bucket(field=[responseBin, responseBinNumber])
| sort(responseBinNumber, limit=1000)
| drop(responseBinNumber)
Query breakdown:
Use a case statement to categorize each event's response time into performance bins, such as fast or slow response. Each condition creates two fields:
responseBin: Human-readable label for display
responseBinNumber: Numeric value for sorting (ensures bins appear in correct order)
Create time-based buckets and groups events by both time and response bin.
Sort results by performance such that the Y-axis is sorted: this helps making the heat map easier to interpret.
Drop the responseBinNumber field from final output since it was only needed for sorting. The heat map will display labels (< 1, <5, etc.) instead of numbers.
This query is useful, for example, to understand response time distribution patterns or spot unusual spikes in slow response bins.
Configuration:
From the
Searchpage, type your query in the Query Editor → clickChoose in the Widget selector
Click the style icon : this opens the Format panel on the side where some properties are already configured by default based on the query result.
Modify other widget's properties to obtain the look and feel of this heat map. For example:
Customize axes configuration by modifying the angle of the X-axis and change the Y-axis order as ascending (fast to slow).
Customize legend configuration by setting the legend position to the right and the minimum value to show to 2000.
In Colors, change the palette from the default color to teal.
You can further customize this widget by setting more properties, see Heat Map Property Reference.