
Frequent query operations
Querying events in LogScale means to combine, mix or match, filter or group elements together to get different results from the same logs. Some of the most frequently used query operations include the following.
Search strings
The first and simplest query that can be done in LogScale is searching your data as you would normally do in a web browser, by means of the symbols commonly used to refine web searches.
"erro"
This search will look for strings in your data that have the word
error, or
gingerroot, or
ferrous, or even a portion of
these words — for example, looking for
"info" will also return any string
containing the word sinfonie.
"64.*"
In this example we are searching all events that have IP addresses
starting with 64 in their strings.
@rawstring=/^64/
This search will return all strings where the
@rawstring field starts with
64.
url=/prod/
This search will return all strings having the word
product in the
url field.
Make searches case-insensitive
Free-text searches in LogScale are case-sensitive by default,
meaning that searching for ERROR
will not match events with the string
error.
Searches can be made case-insensitive by adding the option
i at the end of a
regex, this indicates you want the regex to be case-insensitive:
/windows/i
In this example, all strings with either the word
WINDOWS or
Windows or
wInDoWs will be
returned in the results.
Filter fields
With filter expressions (or, simply, filters) you can filter your events finding only events that have a specific value of a certain field:
method="GET"
In this example, we are selecting all events that have the value
GET in the field
method.
If you are used to SQL, filters are very much like the
WHERE clause of an SQL-query.
Combine filters
You can combine filters using the
and and
or logical operators.
method="GET" or
method="POST"
This query will find events with GET or
POST in the field
method.
You can also use the Wildcard character
* to specify any text:
method="P*" or
method="D*ETE"
The and operator is applied
implicitly if no operator is present:
method="PUT" example.com
This will find events with PUT
in the method field, and example.com
anywhere in the event.
Examples of filters
Find listed some of the possible filters, with examples, that are widely used in LogScale.
Full text and field filters
example.com and statuscode=200
It reads as follows: find events that contain both text
example.com and status code equal to 200
Negating filters
not example.com
and not statuscode=200
It reads as follows: find events that do not contain the text
example.com and do not have the status
code 200.
All events with a certain field
url=*It reads as follows: match any event that has a field named url.
Events without a certain field
url!=*It reads as follows: find all events, if any, that do not have a field named url.
For more information about filters, see Query Filters.
Compare fields and values
An effective usage of filtering in LogScale is provided by comparing a single field against a certain value, that is, to check if that field's value is greater or less than a defined value — for example:
statuscode > 200
This will return all events having a
statuscode value greater than
200 thus filtering only certain
server error codes, for instance.
test() function
Not only can LogScale make comparisons between one field and
one value, but it can also compare more fields and their respective
values, using the test() function. For example,
we may need to check if the value of a certain
field1 is less than the
value of another field2.
test(field1 < field2)This is an example from a more advanced comparison:
test(field1 != 2 * field2)
where != means "not equal to".
This is a test on two fields named
field1 and
field2 — such a filter
will only select those events where
field1 is not exactly twice
as large as field2.
Let's replace field1 or field2 with real data fields.
groupBy(userid, function=[
{statuscode = 200
| count(as=status200)},
{statuscode = 500
| count(as=status500)}
])
| test(status500 > status200)
This will find all user IDs that have more requests with "server
error" status codes (500) than
"success" ones
(200).
Another usage could be:
test(length(userid) == length(method))
This will find all requests where
userid and
method fields have the same
length, will select for example events with
Chad and
POST, and
Peter and
PATCH.
Combine expressions
Several expressions can be chained in a LogScale query using the
pipe operator (|).
Just like in Unix, the pipeline operator takes the output of the expression on its left side and uses it as the input for the expression on its right side.
In the following example, we are counting the number of
GET requests in the current search interval.
method="GET"
| count()
Tip
To use multiple lines in the Query
editor, press
Shift+Enter then
type the pipe (|) symbol
followed by the search term.
Aggregate data
Whereas filters return a selection of events, aggregation functions combine events to produce new results that are no longer the events — often a single number or row. Some examples on the mostly used aggregation functions follow.
Use the avg() function
avg(responsesize)Calculates the average value of the field responsesize and returns just one number as the result, showing the field _avg in the Fields panel:
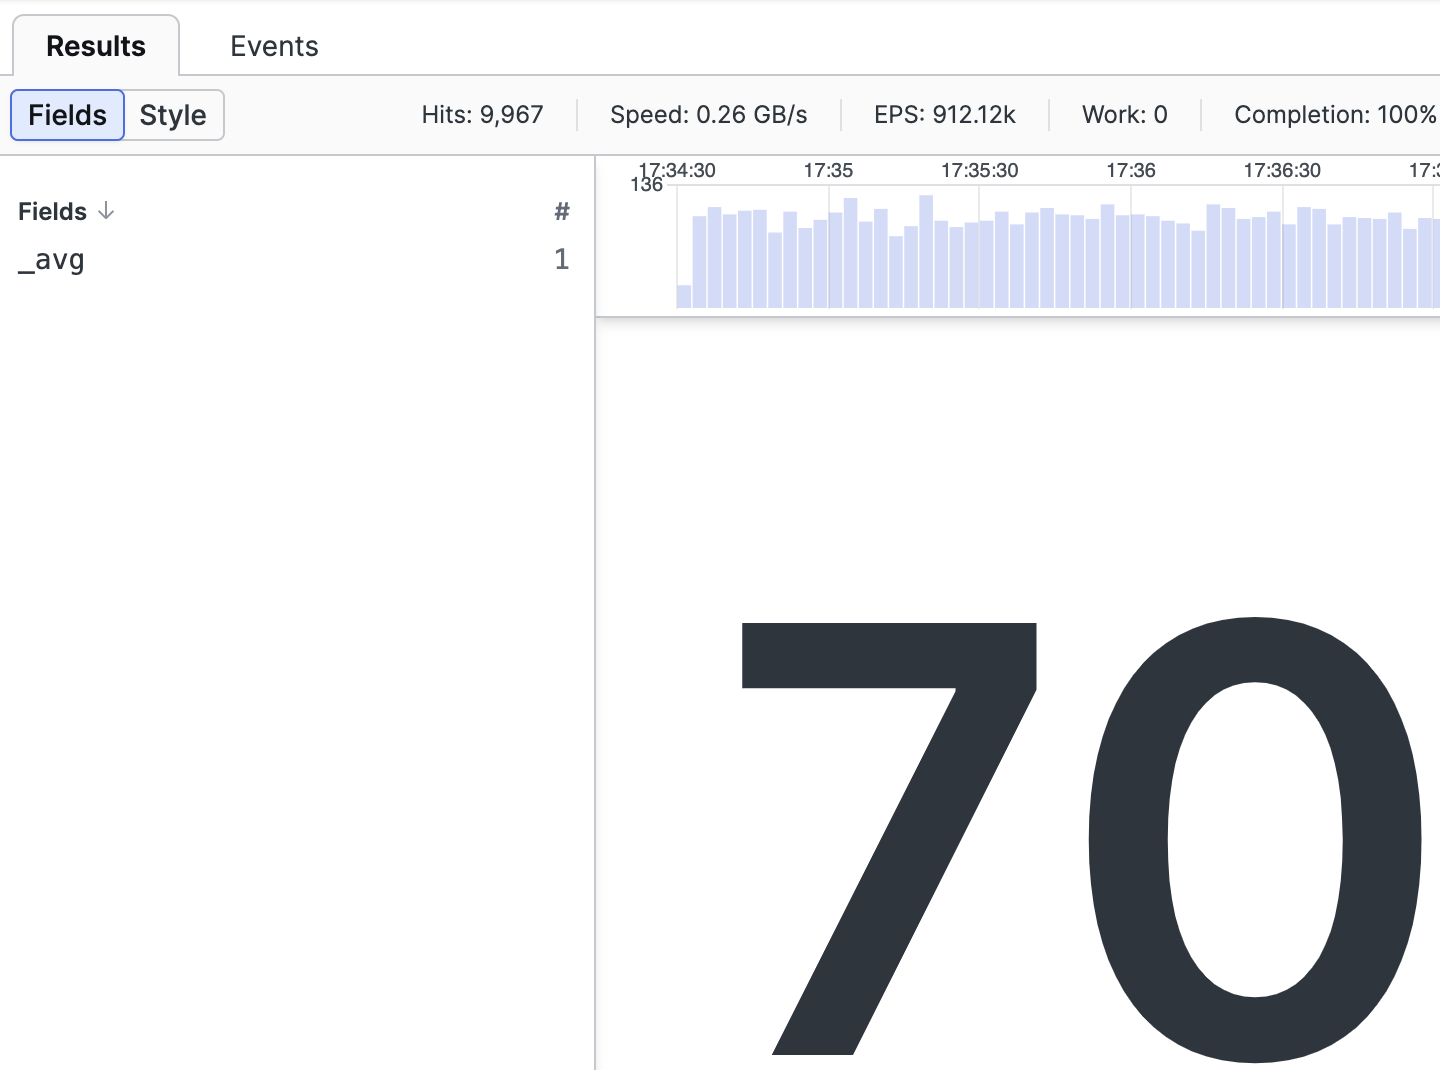 |
Figure 140. Aggregate Result, _avg Example
Use the count() function
Used to count the number of certain events in the repository. For example, we may want to get the list of the status codes found when users access a web site, as well as the total count of each of them:
count(field=statuscode)It returns just one number as the result, showing the field _count in the Fields panel:
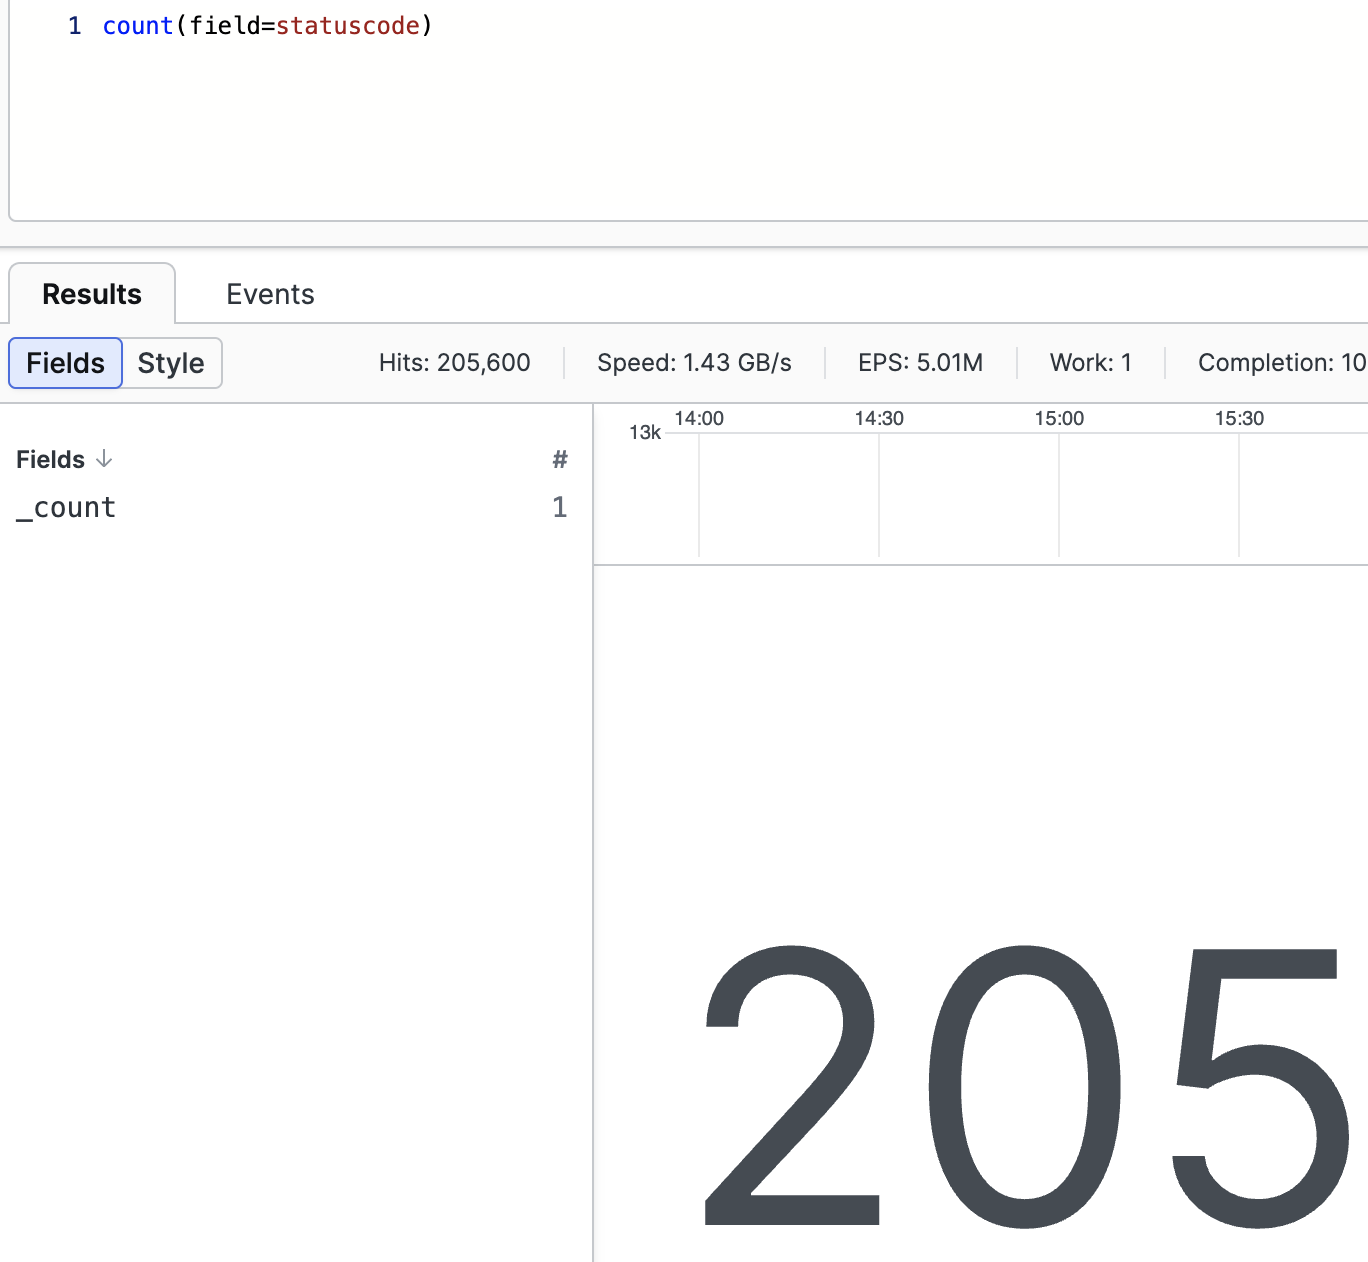 |
Figure 141. Aggregate Result, _count Example
Use the groupBy() function
Used to group events based on the value of one or more fields.
groupBy(method)The result is a table with a row for each method and the number of times that method has been observed:
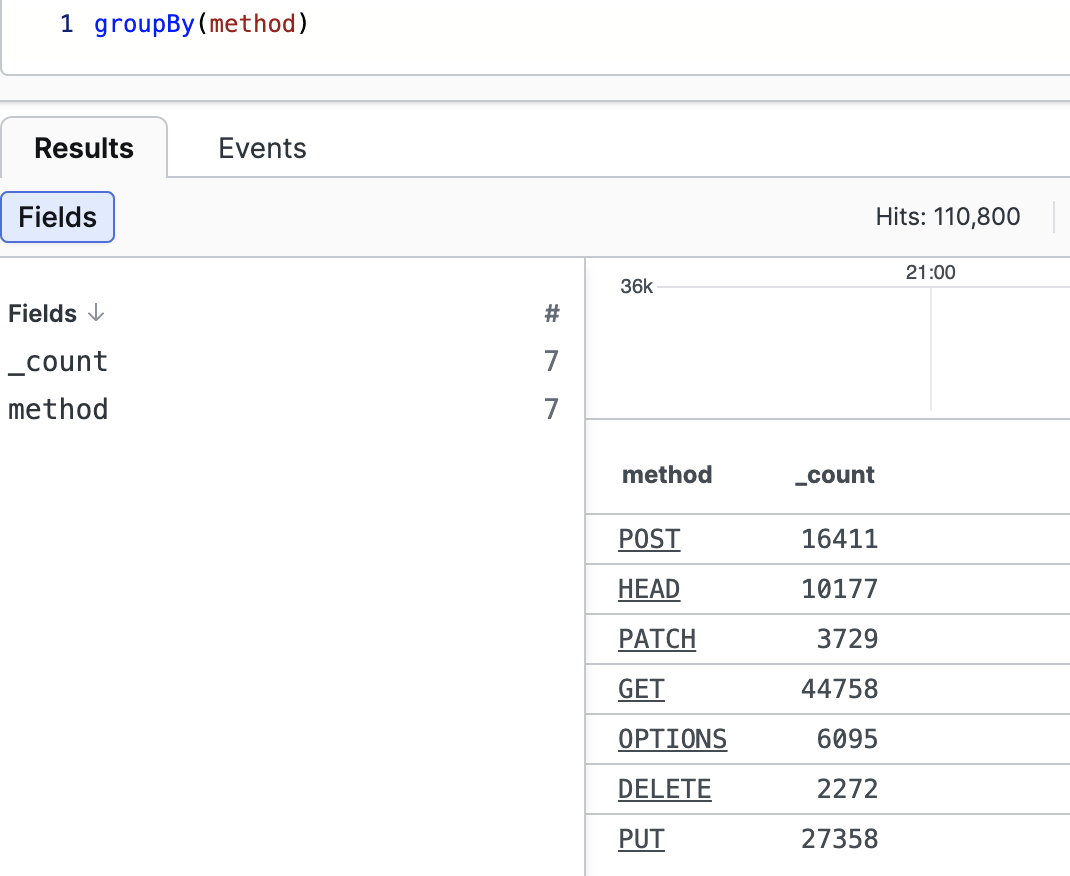 |
Figure 142. GroupBy Result, Example One
The query above is a shorthand for:
groupBy(field="method")or for:
groupBy(field="method",
function=count(as="_count"))
Both will produce the exact same result.
Since groupBy() is used very frequently, the
parameters
function and
as have default values,
and field is the unnamed
parameter for groupBy().
A similar example of the groupBy() function would
be:
userid=*
| groupBy(userid, function=count(as="_count"))
The result is a table with a row for each user and the number of times that user has appeared in the events:
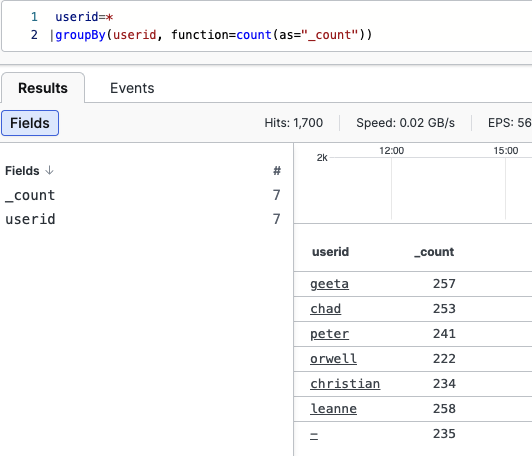 |
Figure 143. GroupBy Result, Example Two
The as parameter can do
more, see details at
Rename output fields.
Grouping can also be done by multiple fields, as in the following example:
groupBy([url, statuscode])Note
The maximum number of elements in a groupBy()
function is set to 20000.
Use the timeChart() function
Used to plot events that have a certain field and produce a chart where the X-axis is time.
For example, events that have a field named responsesize are grouped into series in the timechart, based on its values:
timeChart(responsesize)The same result can be obtained with the query:
responsesize = *
| timeChart()
Use the stats() function
Used to compute multiple aggregate functions over the input.
This is equivalent to count() function.
stats(function=count())In the following example, this function will find the maximum and minimum responsesize:
[min_response := min(responsesize), max_response := max(responsesize)]See Query Functions for more descriptions and examples on these and other aggregation query functions.
Transform or modify data
While some functions like groupBy() result in
completely new records other functions just modify the input records, by
adding, removing or updating fields in the results set.
Some popular transformation functions are listed here.
Use the eval() function
Can modify existing fields or create new ones on-the-fly. For example, we may want to show the responsesize field in kilobytes instead of bytes:
eval(sizeInKb=responsesize / 1000)Use the concat() function
Allows you to associate the values of a given set of fields and add a new field that contains the merge between those concatenated values. Consider having events that contain either a list of users and a list of the URLs visited, see this example query:
concat([url, userid], as="combined")The values of the fields url and userid are concatenated, for example, put together, to show which user navigated which URLs in the newly created combined field:
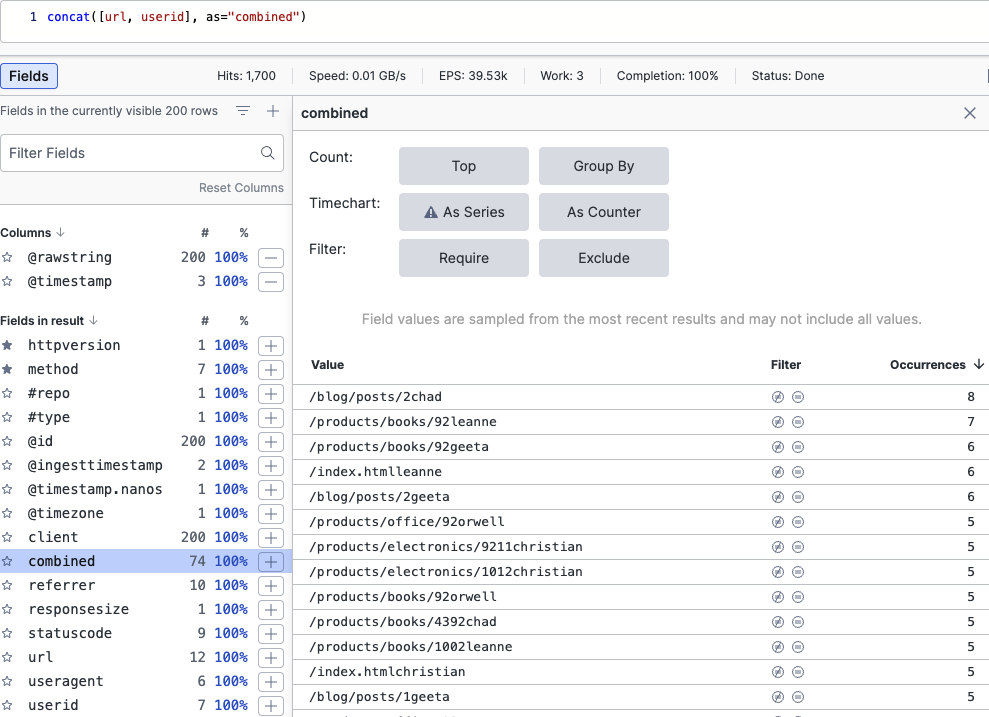 |
Figure 144. Concatenating Fields
For a detailed description of the
as parameter, see
Rename output fields.
Use the array:contains() function
Takes an array-prefix and a string and searches all array elements for each event. Any event that does not have an array containing a matching entry is filtered and dropped from the search results. For example, given a sequence of events containing incidents in an incidents array, find all events or hosts containing the 'Cozy Bear' incident:
array:contains("incidents[]", value="Cozy Bear")Use the replace() function
Can replace text in field based on regular expressions, and also support capturing groups. Here is an example of string replacement:
replace("\/products\/(.*)", field=url, replacement="[\"category\"]=$1")Use the select() function
Can select a set of fields from each event, particularly useful if you
need to export those fields. For example, look at
PUT HTTP method and get a table
that selects userid and
responsetime fields in the
searched time range, to be exported in a
CSV file.
method=PUT
| select([userid, responsetime])
Use the regex() function
Regular expressions are described in detail in Extract data fields.
See Query Functions for more descriptions and examples on these and other transformation query functions.
Extract data fields
One important transformation function is regex(),
used to extract new fields by means of a
regular expression that can
contain one or more capturing groups.
For example, you may want to use the logs to figure out which product pages are the most visited.
regex("/products/.+/.+ HTTP/")
The expression above matches events that contain text like for example
/products/books/102 HTTP/
— the Event List will now return URLs
containing such texts.
Regular expressions are so common that there is even a literal syntax for writing them:
/\/products\/.+\/.+ HTTP\//i
In the query example above, the information about the product category
and product id is encoded in the URL and is not available as a field.
That means you cannot do a groupBy(). To solve
this, you can run:
regex("/products/(?<category>.+)/(?<productId>.+) HTTP/")This will extract new fields for each event that matches the regex. This syntax is called Groups and back references.
The Event List will now contain two new fields category and productId, which you are now able to group to determine how many product categories there are:
regex("/products/(?<category>.+)/(?<productId>.+) HTTP/")
| groupBy(category)
If you are regularly extracting data from events, it is more efficient to do this during parsing. See Parsing for more information.
Rename output fields
LogScale allows you to change the name originally assigned to the output fields, to be displayed as you want, with the scope of giving titles that would be more meaningful to the users.
This is done by adding the parameter
as, with the
count() function.
We will take the example seen at figure
Figure 143, “GroupBy Result, Example Two”
and modify that query by replacing the value
_count with
Total per User with the
as parameter:
userid=*
| groupBy(userid, function=count(as="Total per User"))
The Event List will show the same count result as
with the standard groupBy() query, but in a field
now renamed Total per User.
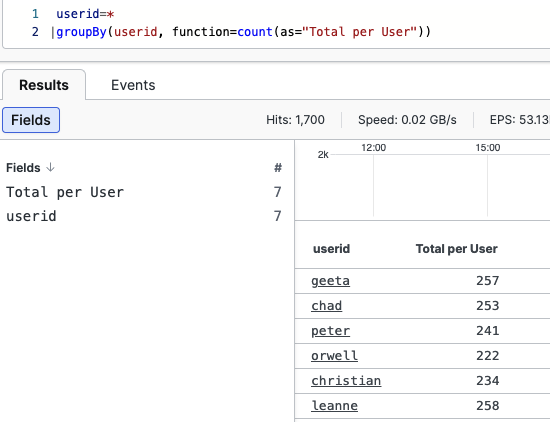 |
Figure 145. Renaming Fields, Example One
Here is a similar example of query with
as parameters:
statuscode >= 500
| groupBy(url, function=count(as="Error Count"))
This combined expression firstly selects only those events with URLs having a statuscode equal or greater than 500, and then group the URLs by counting their respective errors.
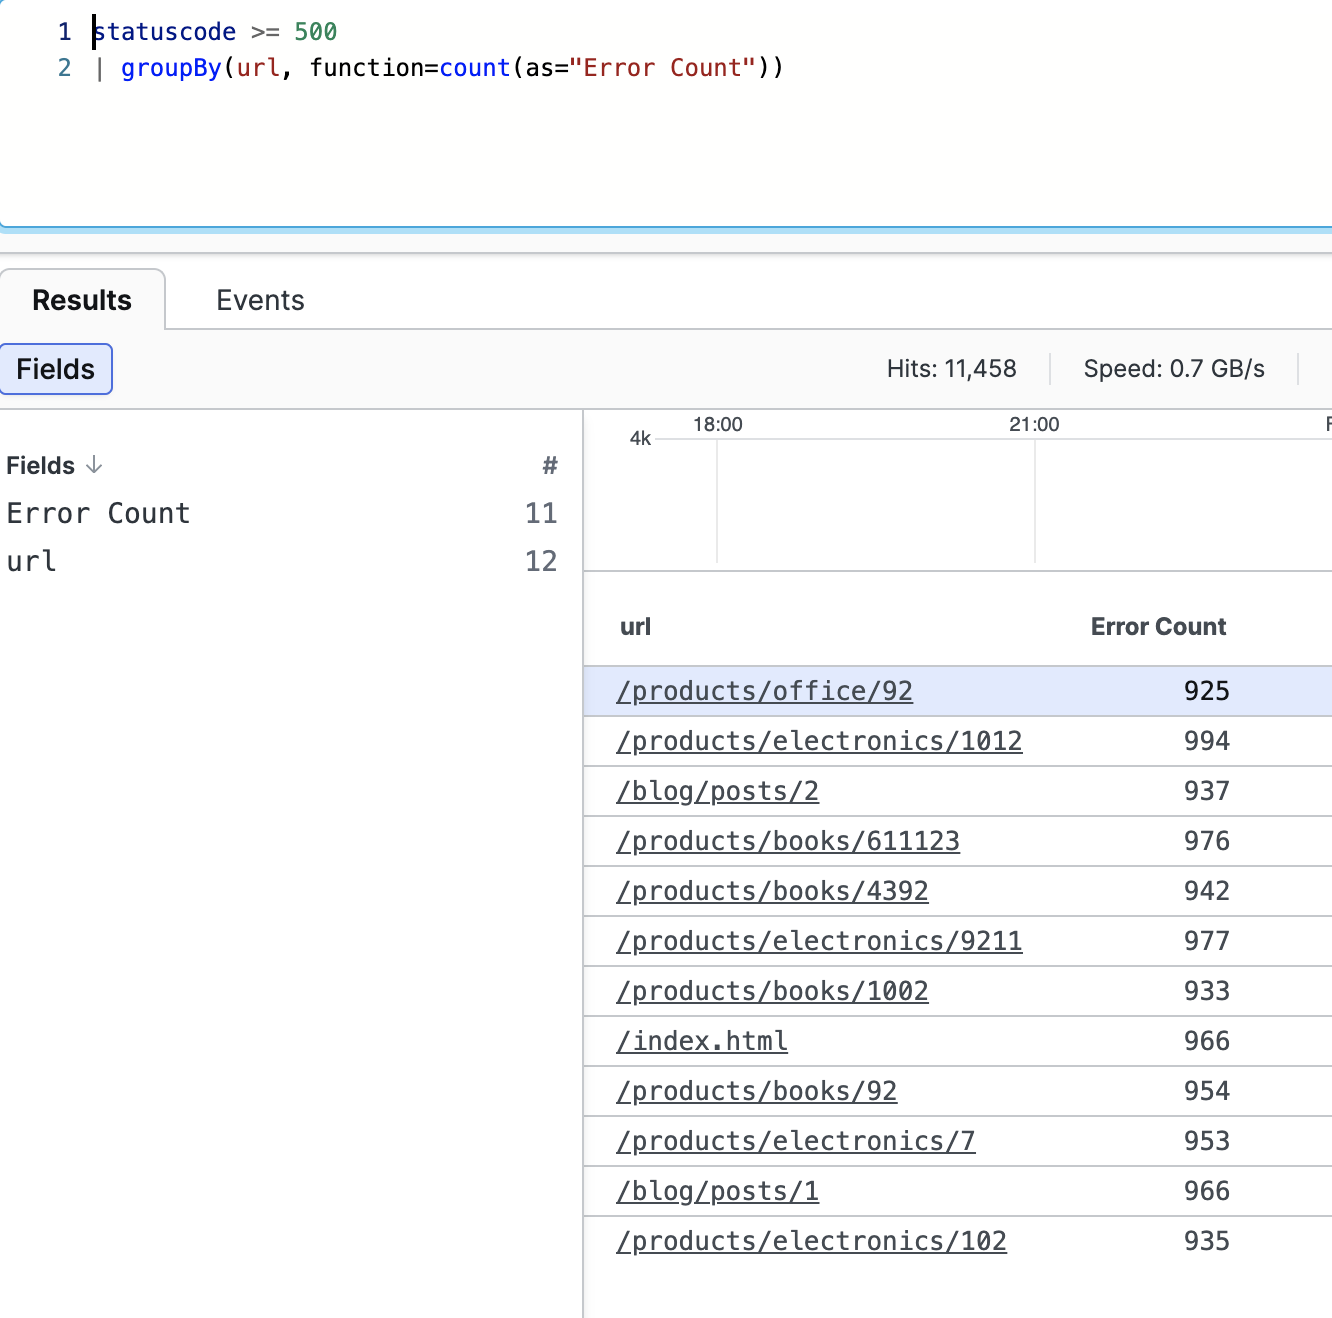 |
Figure 146. Renaming Fields, Example Two
The result table will display the error occurrences under the Error Count column, with values from the field now renamed as Error Count.
Another simple way of renaming fields is by using the
rename().
Format data
Formatting functions can serve different purposes: change how events look as they enter LogScale and before they are stored; change how results look before they are presented to the user. For example:
format("%.2f", field=amount)This will set how the field value (the amount) should be formatted — 2 decimals — thus changing the results so that they show only two decimal places.
Join data
LogScale allows the pairing of two searches in order to get combined results through intersection of two types of data.
This is done with Join Query Functions query functions — they associate a primary query with a subquery, thus correlating events coming from different datasets. See Query Joins and Lookups for detailed information on how LogScale searches and processes information by combining two different sets of data.
For example, an interesting usage of such correlation of events would be the case where you have one event containing email data (email ID, sender and recipient, subject) and another event containing a score about the phishing behaviour of the emails, as well as the email ID.
In this use case example, we would have two datasets like this:
| emailID=X123 from=peter to=paul subject='Click this link' |
| emailID=X128 from=alice to=paul subject='Remember to sign up for lunch' |
| emailID=X123 phishiness=1.5 |
| emailID=X128 phishiness=0.7 |
which, if queried this way:
beta:repeating(5m)
| from=* to=*
| join({phishiness > 1.0}, field=emailID, include=[phishiness])
| select([emailID, phishiness, from, to, subject])
would return all the possible suspect emails.
Note
Join queries work perfectly well with static, "historical" queries;
however, you might experience some difficulties in making them work
with live queries. To solve this, a
beta:repeating() can be added in the query.
In the example query above, the beta:repeating()
function is used because we want our query to be
live.This function is a beta feature and may not
work as expected.
To make these kinds of query work, you need to:
Make sure that the two different events you want to join have an ID in common, meaning they share the same key (like in the example case above).
Define the keys or fields that are used to match the results, in cases where there isn't a common item to join by (this can be done by assigning a dummy value to a dummy key field), or where the key values are in different fields.
Make sure your subquery (or inner query) is made against an event set that would presumably return a small result (in the example case above, we don't expect to have many email IDs reporting phishing).
For much more details on LogScale Join concepts and behaviour
and the relevant query functions, see join() Syntax and
Join Query Functions respectively.
Special behaviour for live joins
join() functions do not support live queries, for
the reasons explained in
Join Operation and Optimization.
As a consequence, when you enable the
Live mode checkbox for a query
using join(), be aware, that the query will not
be run truly live but repeatedly instead, aiming
to provide the most recent results.
For this purpose, an indicator in the UI will specify the last time the query was run:
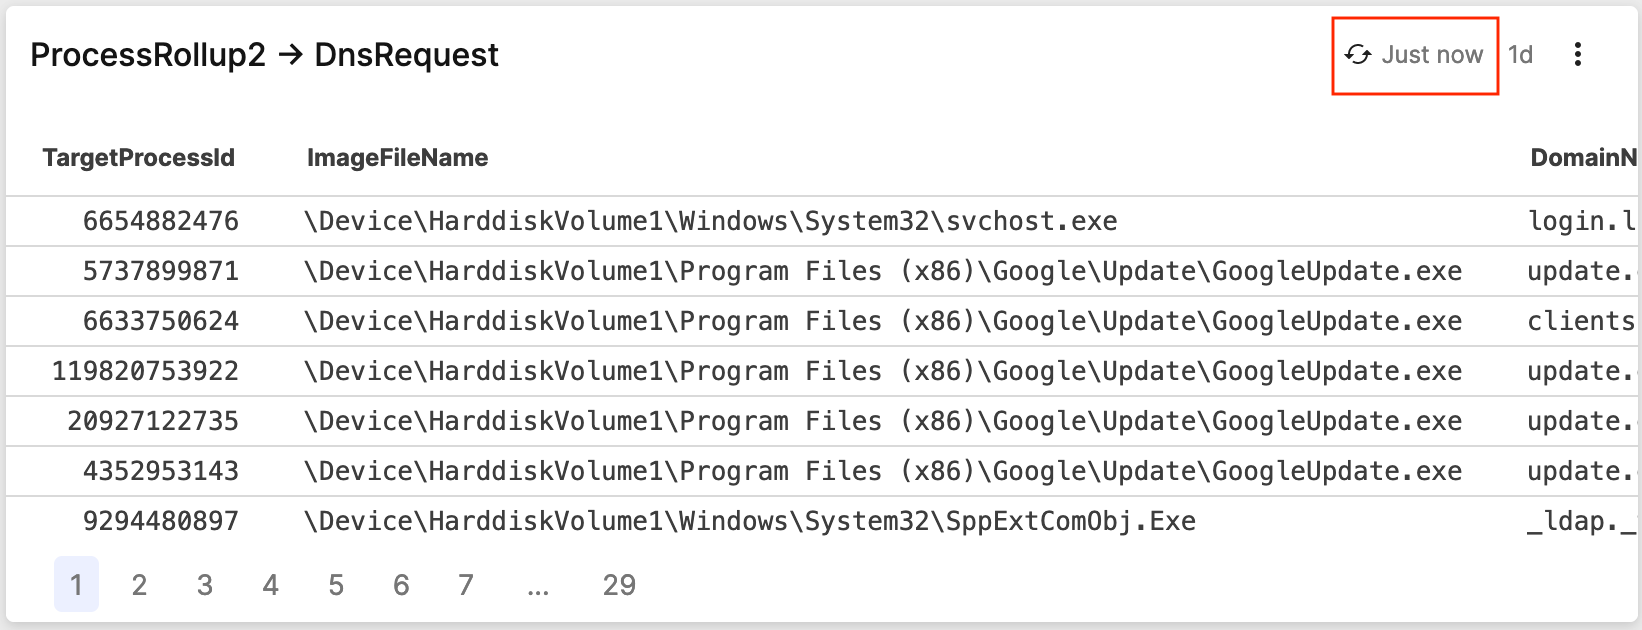 |
Figure 147. Repeating Query Indicator