
Dashboard Widgets
LogScale's dashboard widgets are continuously evolving to provide enhanced visualization capabilities for users. A notable example is the replacement of the gauge widget with the single value widget, which introduced valuable features like spark lines and trend indicators alongside displayed values.
LogScale is constantly improving the available dashboard widgets so check Dashboards for updates. An example of this is the single value widget, which replaced the old gauge widget. The single value widget added the ability to have spark lines and trends attached to the shown value, which was a very useful addition for users.
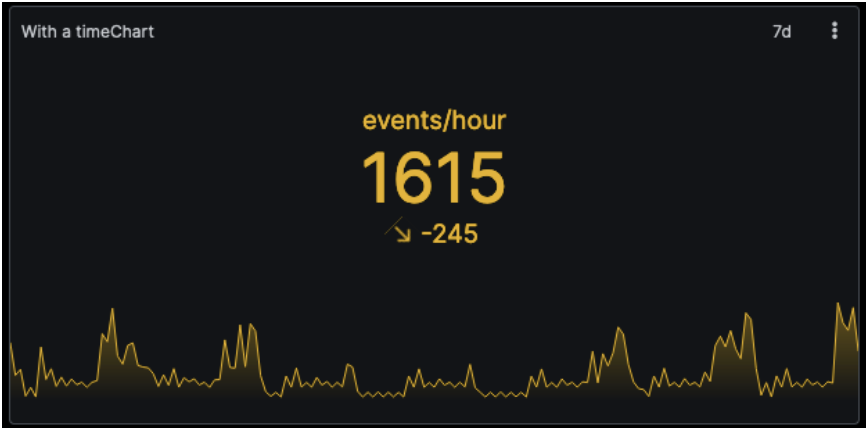 |
Figure 73. New Widgets