
Authentication Methods Distribution
Analyze the distribution of authentication methods. This chart supports several security and compliance objectives, such as:
Quickly see what percentage of authentications rely solely on passwords
Monitor the proportion of MFA-enabled authentications
Identify which user groups need MFA enhancement
Identify service accounts or systems using certificate authentication
Visualization: the pie chart visualizes the relative proportion of each authentication methods. Each unique method value becomes a slice; the count of each method determines the size of each slice. The chart positions the largest slices first (clockwise from top).
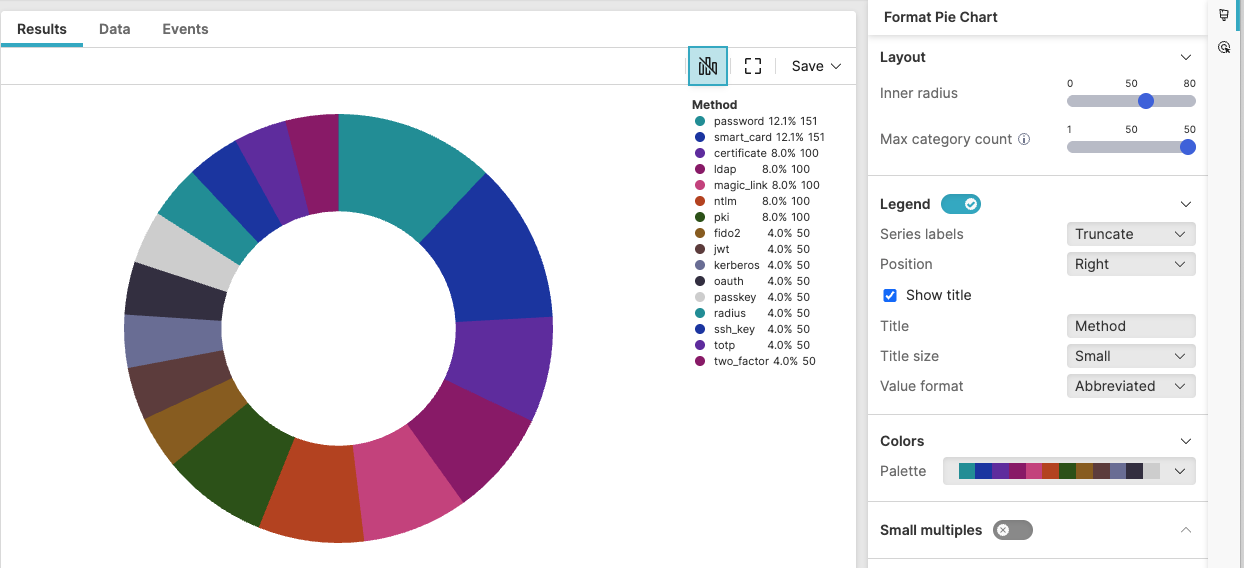 |
Figure 231. Authentication Methods Distribution
Sample input data:
| auth_method | status | timestamp | user |
|---|---|---|---|
| Password | success | 2025-08-11T00:01:23Z | john.doe |
| MFA | success | 2025-08-11T00:01:24Z | jane.smith |
| Certificate | success | 2025-08-11T00:01:25Z | service.account |
| Password | success | 2025-08-11T00:01:26Z | bob.wilson |
| SSO | success | 2025-08-11T00:01:27Z | mary.jones |
Query:
auth_method=* status=success
| groupBy(auth_method, function=count())
| sort(_count, order=desc)
Query breakdown:
Filter to include only events that have a value for the auth_method field – that is, the wildcard
*matches any non-empty value.Filter successful authentications only.
Group all filtered authentication events by unique values in the auth_method field.
Count events in each group by applying the
count()function.Create a field named _count containing the number of authentication events for each method.
Sort the grouped results by the _count field in descending order, ensuring the most common methods appear first.
Configuration:
From the
Searchpage, type your query in the Query Editor → clickChoose in the
Widget SelectorClick the style icon : this opens the Format panel on the side where some properties are already configured by default based on the query result.
Modify the properties to obtain the look and feel of this example widget, as follows:
Toggle Legend on. If there is only one item in the chart, the legend does not show.
Set the position of the legend to
RightSelect Show title to display the legend title, then assign a name to the legend title and adjust its size to
SmallChange the inherited Colors palette to one of the available custom palettes.
See Pie Chart Property Reference for more customizations of this widget.