
Triggers
Triggers use queries to set off actions when the query produces a result, so you do not have to rely on a routine of checking LogScale and executing queries manually or programmatically, and can detect problems as soon as they occur. There are four types of triggers: Scheduled searches, Aggregate alerts, Filter alerts, and Legacy alerts. The alerts use live queries that run continuously on ingested data, setting off one or more actions when the query returns a result. Scheduled searches use static queries and run on a regular schedule on stored data, setting off one or more actions when the query returns a result. Using triggers enables automation for notifying analysts and administrators through different integrations, such as email or forwarding to another repository.
Tip
If you are just learning about triggers in LogScale, it is a good idea to read General Information About Triggers.
Click the tabs below to explore each of the trigger types available:
A scheduled search is a static query that is set to run on a schedule. At a scheduled interval, the query runs and if its result is not empty, the scheduled search triggers and executes its associated action(s) once for the whole query result.
When to use scheduled searches
Scheduled searches are a type of trigger, like alerts, and they are able to trigger the same actions as alerts. However, scheduled searches are applicable in other use cases than alerts, such as when:
You need to automatically report some search result on a schedule. For instance, you have stakeholders that expect to get an email every Monday at 10:00 containing the top most important security events for the previous week. If you prefer to deliver the results in a dashboard, use Schedule PDF Reports.
You need to take delayed action on search results. For instance, if you trigger user bans using an alert, offending users will be banned immediately upon a transgression and can then easily figure out what triggered their ban. Using a scheduled search, you can choose to ban all offending users at the same time every day, as to obscure the conditions of a ban.
You have a query using
join()ordefineTable(). When the query returns an aggregate result with one or more rows, the trigger is activated.If your situation requires instant notification about events that do not happen regularly, an alert is a better option. Alerts run as live queries, rather than static ones, which makes them generally more performant.
The humio-activity repository lists all activity logs with a suggestion of how to resolve the issue depending on the level of severity, see Monitor Triggers with humio-activity Repository for more information.
To enable scheduled searches, the environment variable
ENABLE_SCHEDULED_SEARCHESmust be set totrueon every host in the cluster.Timestamp for scheduled searches
Scheduled searches can be configured to either run on @ingesttimestamp (default) or @timestamp. For more information about what to choose, see Which timestamp to use for trigger.
Ingest delay for scheduled searches
Scheduled searches use the @ingesttimestamp by default, meaning they are only affected by ingest delay inside LogScale. You can configure an amount of time to wait for ingest delay in LogScale to accomodate for that.
If a scheduled search runs on @timestamp, the scheduled search will be affected by ingest delay both inside and outside of LogScale. If you want a scheduled search to find all data, you need to account for ingest delay when configuring the scheduled search. If you have a scheduled search running every hour searching back one hour from when it runs, and the ingest delay is 20 minutes, then all events inside the last 20 minutes of each time window will not be found, as they are not yet searchable in LogScale when the query runs:
%%{init: {"flowchart": {"defaultRenderer": "elk"}} }%% gantt dateFormat HH:mm axisFormat %H:%M tickInterval 1hour todayMarker off section A 1 hour search :a1, 07:00, 60m Delay :crit,07:40, 20m section B 1 hour search :a1, 08:00, 60m Delay :crit,08:40, 20m%%{init: {"flowchart": {"defaultRenderer": "elk"}} }%% gantt dateFormat HH:mm axisFormat %H:%M tickInterval 1hour todayMarker off section A 1 hour search :a1, 07:00, 60m Delay :crit,07:40, 20m section B 1 hour search :a1, 08:00, 60m Delay :crit,08:40, 20mIn order to handle that, you need to offset the query by the largest ingest delay that you want to accomodate. So instead of running the example scheduled search in the diagrams above from 1h to now, run it with an offset of 20 minutes:
%%{init: {"flowchart": {"defaultRenderer": "elk"}} }%% gantt dateFormat HH:mm axisFormat %H:%M tickInterval 1hour todayMarker off section A 1 hour search :a1, 06:40, 60m Offset :active,07:40, 20m section B 1 hour search :a1, 07:40, 60m Offset :active,08:40, 20m%%{init: {"flowchart": {"defaultRenderer": "elk"}} }%% gantt dateFormat HH:mm axisFormat %H:%M tickInterval 1hour todayMarker off section A 1 hour search :a1, 06:40, 60m Offset :active,07:40, 20m section B 1 hour search :a1, 07:40, 60m Offset :active,08:40, 20mTiming scheduled searches
When deciding on the timing for your scheduled searches, it is important to consider the events and what you plan to do with the data.
If the scheduled search is aggregating events, the time window should match the time period you want to aggregate over.
If the scheduled search is correlating events, the time window should be large enough for all events that should be correlated with each other to be within the time window.
If the scheduled search is finding single events, the time window can be set as desired, down to 1 minute.
If you want the scheduled search to search through every period of real time completely and exactly once, the schedule and Time window should match, e.g. running the search every other hour over a 2-hour time window.
Retry for scheduled searches
Scheduled searches automatically retry failed runs, as long as they are not too far behind.
When running on @ingesttimestamp, Max wait time controls for how long to retry. Assuming a scheduled search runs every hour on the hour, fails the run at 13:00, a max wait time of 5 minutes means that the run at 13:00 will be retried until 13:05.
When running on @timestamp, retry is controlled by the Backfill limit, which sets how many runs the scheduled search is allowed to be behind. Assuming a scheduled search runs every hour on the hour, fails the run at 13:00, a backfill limit of 0 means that the run at 13:00 will be retried until 14:00, at which time the 14:00 run will start. A backfill limit of 2 means that the 13:00 run will be retried until 16:00, at which time there are 3 newer runs (14:00, 15:00, and 16:00), so the 13:00 run will be skipped and the 14:00 one will run next.
Query warnings for scheduled searches
In case of query warnings, scheduled searches will not fail. Query warnings are:
Warnings that are logged and reported in the status of the alert, but otherwise continue despite.
Warnings that are treated as errors, since they mean that the result can be completely wrong.
Warnings about missing data. When running on @timestamp, scheduled searches wait for up to 10 minutes for missing data to become available. When running on @ingesttimestamp they wait up to whatever is set for Max wait time. Delay run does not influence how these warnings are handled.
The humio-activity repository lists all activity logs with a suggestion of how to resolve the issue depending on the level of severity, see Scheduled Search Errors and Solutions for more information.
Aggregate alerts are based on aggregating queries within a given search interval. Searches can be run so that no time interval is missed and no time interval is checked twice, and queries are re-run in case of any problems.
Aggregate alerts have the following attributes and behaviors.
The events going into the first aggregate function can also be sent to Actions. See Send aggregate results to actions.
If the configured throttle period matches the search interval, queries are run back-to-back, meaning that the next interval starts right after the first one. This way, no time interval is missed and/or considered twice during query execution.
If there are instabilities in the system, the failed queries will rerun for up to 24 hours so that alerts can catch up if the system has been down. This behavior guarantees reliability of the alert in case of an infrastructure failure.
Use the configuration parameter
AGGREGATE_ALERTS_MAX_CATCH_UP_LIMITto set the catch-up period.Aggregate alerts DO NOT support: Join Query Functions; explicit bucketing functions like
bucket()andtimeChart();start(),end(), andnow()functions; ; or ad-hoc tables.Aggregate alerts may contain Filtering Query Functions, but the whole query must contain at least one Aggregate Function.
The environment variable
ENABLE_AGGREGATE_ALERTSmust be set totrueon every host in the cluster.If an alert query is not executing it is advised to wait for 20 minutes, after which it should restart. If restarting the query is not possible, or if you cannot wait that long, it is recommended to disable the alert, wait for one minute, and then enable the alert again. This will "reset" the alert to only run from now on and not retry any missed data.
Timestamp for aggregate alerts
Aggregate alert queries can be configured to either run on @ingesttimestamp (default) or @timestamp. For more information about what to choose, see Which timestamp to use for trigger.
Ingest delay handling for aggregate alerts
Aggregate alerts run on @ingesttimestamp by default. These alerts are only affected by ingest delay inside LogScale. It is possible to configure (only through the API) how the alert should react to ingest delay in the so-called trigger mode. The options are
Complete(default) andImmediate. WithCompletethe alert will wait for up to 20 minutes on ingest delay before triggering, ensuring that the result is complete, as long as the ingest delay is at most 20 minutes. WithImmediatethe alert will trigger as soon as it sees a non-empty query result, which might be partial due to events that are not yet searchable.Aggregate alerts running on @timestamp are affected by ingest delay both inside and outside of LogScale. It is possible to configure (only through the API) how the alert should react to ingest delay in the so-called so-called trigger mode. The options are
CompleteandImmediate(default). WithCompletethe alert will wait for up to 20 minutes on ingest delay inside LogScale before triggering, but ingest delay outside LogScale is not handled automatically. WithImmediatethe alert will trigger as soon as it sees a non-empty query result, which might be partial due to events that are not yet searchable.For aggregate alerts, you can change the triggering mode via GraphQL to handle ingest delays. For more information, see Ingest delay handling for aggregate alerts.
Time window for aggregate alerts
The aggregate alert query internally uses buckets and the bucket span of an aggregate alert depends on the time window.The minimum time window is 1 minute and the maximum is 24 hours. When setting the time window for aggregate alerts, remember the following:
If the aggregate alert is aggregating events, the time window should match the time period you want to aggregate over.
If the aggregate alert is correlating events, the time window should be large enough for all events that should be correlated with each other to be within the time window.
If the aggregate alert is finding single events and the query is running on @ingesttimestamp, the time window can be kept small, down to 1 minute.
These are the only allowed time windows:
Time window Bucket span 1 - 30 minutes 30 seconds 31 - 80 minutes 1 minute 82 - 180 minutes 2 minutes 4 - 8 hours 5 minutes 9 - 16 hours 10 minutes 17 - 24 hours 15 minutes An aggregate alert will only trigger and execute its action(s) on matching results once a bucket is full. So an aggregate alert with a time window of 1 hour can only trigger on time intervals 13:00-14:00, 13:01-14:01 and so forth.
For information about the valid intervals when using Custom interval, see Time window.
Throttling for aggregate alerts
Throttling is required for aggregate alerts. For general information about throttling, see Throttling.
General throttling
General throttling means that if the aggregate alert triggers, then it does not trigger again until the throttle period is over. So if an aggregate alert triggers at 13:24 and has a throttle period of 1 hour, then it does not trigger again until 14:24 at the earliest and ignores all query results in the meantime.
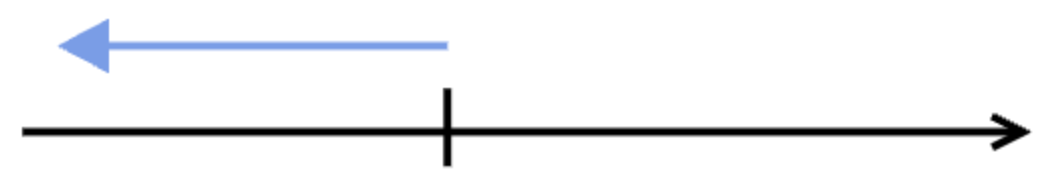
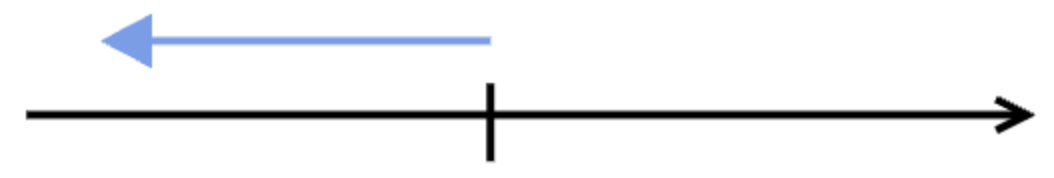
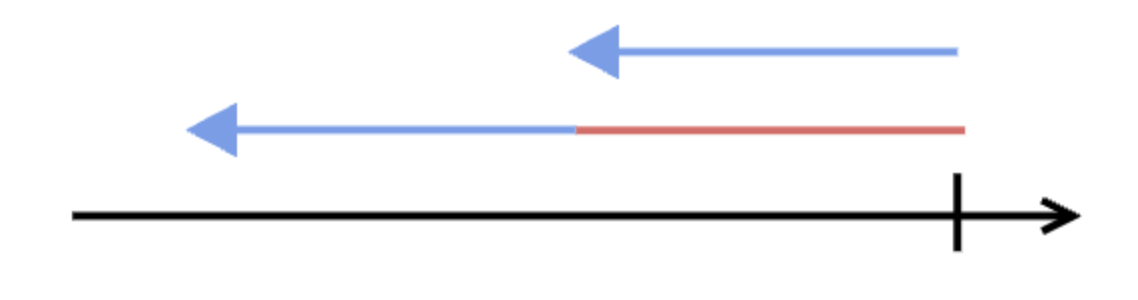
The diagrams below show an example with five runs of an aggregate alert. In the first run, the alert query did not have any result, so the query is checked again shortly after, again with no result.
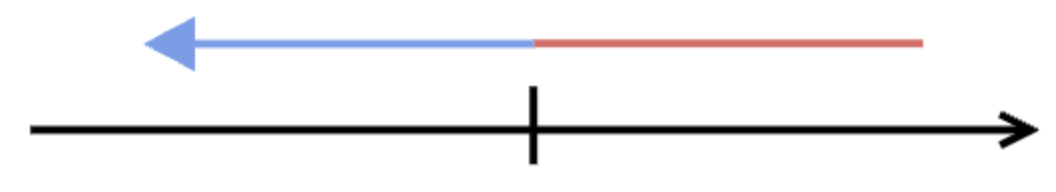
The third time, the alert query has results, so the alert triggers, and a throttle period (red line) is put in place.
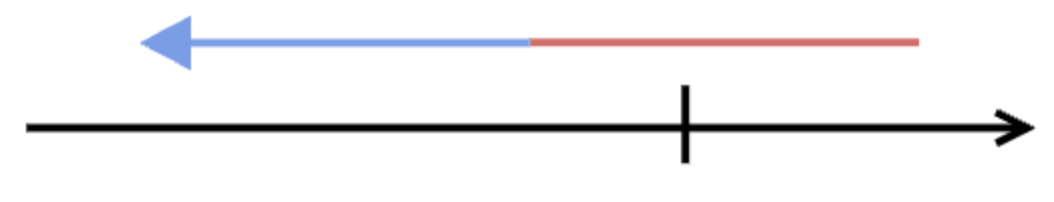
That means that whenever the alert query is checked within the throttle period, nothing happens if the alert query produces a result.
Only after the throttle period is over, the result of the alert query is again being evaluated.
Field-based throttling
Field-based throttling means that if the alert triggers on a query result with events with values 1 and 2 for the throttle field at 13:24, and then at 13:25 sees events with values 2 and 3 for the throttle field, then it will remove the events with value 2 from the query result before executing the action(s). It will only stop filtering events with values 1 and 2 at 14:24 and events with value 3 at 14:25. If it sees a query result where all the events are filtered out, it will not trigger.
Relation between throttle period and time window
Normally, the throttle period should be the same as the Time window. The maximum throttle period for aggregate alerts is 24 hours.
If your search finds specific events on which you want to trigger an aggregate alert, for example specific errors, you want to set the throttle period to match the time window of the search. If you set the throttle period higher than the time window, you might miss events, and if you set it lower, you might get duplicate alerts.
If your search involves an aggregate, you might want to set the time window larger in some cases. For example, you want to be notified every hour if there are more than 5 errors within a 4 hour search window. You probably do not want to set the time window smaller than the throttle period, as this means that there will be events that are never evaluated by the alert. For Actions like Email and Slack, you want a higher throttle period since these triggers do not deduplicate.
Retry for aggregate alerts
Aggregate alerts will retry for up to 24 hours when there are errors with either querying or invoking actions, but not due to ingest delay. The retry time is configurable for self-hosted customers by setting the
AGGREGATE_ALERTS_MAX_CATCH_UP_LIMITconfiguration value. For information about handling of ingest delay, see Ingest delay handling for aggregate alerts. If aggregate alerts are more than 20 minutes behind, they will start running static queries, meaning that they will not trigger on new events until they have caught up with old events.Query warnings for aggregate alerts
In case of query warnings, aggregate alerts will not fail. Query warnings are:
Warnings that are logged and reported in the status of the alert, but otherwise continue despite.
Warnings that are treated as errors, since they mean that the result can be completely wrong.
Warnings about missing data. If they happen in a live query, they are treated based on the triggering mode, similar to how ingest delays are handled (see Ingest delay handling for aggregate alerts). If they happen when running an historic query, the query retries for up to 10 minutes, before giving up and just using the result that is given.
The humio-activity repository lists all activity logs with a suggestion of how to resolve the issue depending on the level of severity, see Aggregate Alert Errors and Solutions for more information.
Filter alerts are based on non-aggregate queries, and are configured to trigger the corresponding action at least once. Filter alerts use a live query, but must not use an aggregate function for execution. Each event in the result set from the trigger query elicits the actions associated with the trigger.
Filter alerts are designed to be triggered when the corresponding query filters an event; each matching event triggers the alert. Filter alerts evaluate each event individually as it enters LogScale.
Filter alerts can trigger at most every 10 seconds, as the underlying processes poll the query at that frequency. A filter alert triggers and executes its action(s) for each event individually that matches the query.
For a one minute search interval, a filter alert can at most trigger on 15 events. If there is no email action associated with the trigger, the action(s) can trigger on up to 100 events. If the filter alert has more frequent matching events, they will not result in additional triggering of actions.
Filter alerts have the following attributes and behavior:
An alert is triggered for each matching event.
Events processed through a filter alert are recorded by the system so that they trigger only once during execution.
Filter alerts do not support Aggregate Query Functions, any Join Query Functions,
copyEvent(),beta:repeating(),defineTable()functions.The @id and @ingesttimestamp fields should be preserved during the filter query execution and thus cannot be overwritten or removed.
If present in the query result, the _bucket field will be removed when the alert query executes.
Filter alerts will process events, including catching up for past events, for up to 24 hours. This means that events are delivered as part of the filter query, provided that the ingest delay for the cluster and time to process each action is smaller than 24 hours. While catching up, the alert will not process new events; if a single event is causing the alert of actions to fail, the alert does not trigger until that event is outside the catch-up limit.
Use the configuration parameter
FILTER_ALERTS_MAX_CATCH_UP_LIMITto set the catch-up period.Filter alerts will wait 10 minutes for query warnings about missing data to disappear. If they do not disappear within this time limit, the alert will give up and the data will not be triggered on.
Use the configuration parameter
FILTER_ALERTS_MAX_WAIT_FOR_MISSING_DATAto set the wait time.Filter alerts are limited to a maximum of 100 triggers per minute. For email actions, the limit is 15. Events exceeding this limit will be ignored.
To configure the limits for maximum number of triggers, set
FILTER_ALERT_EMAIL_TRIGGER_LIMITfor email actions, andFILTER_ALERT_NON_EMAIL_TRIGGER_LIMITfor all other actions.It is possible to set throttle limits in filter alerts to prevent the query triggering a configured action too often. See Throttling for filter alerts.
The environment variable
ENABLE_FILTER_ALERTSmust be set totrueon every host in the cluster.If an alert query is not executing it is advised to wait for 20 minutes, after which it should restart. If restarting the query is not possible, or if you cannot wait that long, it is recommended to disable the alert, wait for one minute, and then enable the alert again. This will "reset" the alert to only run from now on and not retry any missed data.
Timestamp for filter alerts
Filter alert queries always run on @ingesttimestamp. For more information, see Timestamps for triggers.
Ingest delay for filter alerts
Filter alerts automatically handle ingest delay inside LogScale, and are unaffected by ingest delay outside LogScale, since they are running on @ingesttimestamp.
Throttling for filter alerts
Throttling is optional for Filter alerts. Setting a Throttle period is optional for Filter alerts because each event matching the query triggers the alert. The maximum throttle period for filter alerts is 1 week. For general information about throttling, see Throttling.
General throttling
General throttling means that if the filter alert triggers, then it does not trigger again until the throttle period is over. Because filter alerts run on @ingesttimestamp, when a filter alert with general throttling triggers, it will not trigger on any events with an @ingesttimestamp within a throttle period after the @ingesttimestamp of the event, that the alert triggered on. So if a filter alert triggers at 13:24 and has a throttle period of 1 hour, then it does not trigger again until 14:24 at the earliest and ignores all query results in the meantime.
Field-based throttling
Field-based throttling means that if the alert triggers on a query result with events with values 1 and 2 for the throttle field at 13:24, and then at 13:25 sees events with values 2 and 3 for the throttle field, then it will remove the events with value 2 from the query result before executing the action(s). It will only stop filtering events with values 1 and 2 at 14:24 and events with value 3 at 14:25. If it sees a query result where all the events are filtered out, it will not trigger.
Query warnings for filter alerts
In case of query warnings, filter alerts will not fail. Query warnings are:
Warnings that are logged and reported in the status of the alert, but otherwise continue despite.
Warnings about missing data. The alert will trigger immediately on all events that it finds, even in the presence of such warnings, but it will wait for up to 10 minutes to see if the query warning goes away and more events are found. The behavior is the same whether the alert is running a live query or a historic query to catch up. The 10 minute waiting period is configurable for self-hosted environments using the
FILTER_ALERTS_MAX_WAIT_FOR_MISSING_DATAparameter.The humio-activity repository lists all activity logs with a suggestion of how to resolve the issue depending on the level of severity, see Filter Alert Errors and Solutions for more information.
Note
When creating new triggers, do not use Legacy alerts as they are not as reliable as other trigger types. For instance, they do not retry and do not guarantee that all events are seen at least once by the alert.
For information about recommended alternatives to Legacy alerts, see What Trigger Type to Choose.
Legacy alerts (formerly known as Standard Alerts) are triggered by queries that generate a result set. Similar to Aggregate alerts, Legacy alerts work by returning the results from an aggregate query; when the query returns an aggregate result with one or more rows, the alert is triggered. If the query is not already an aggregate query ,
tail(200)is appended to the query to make it an aggregate query. Legacy alerts are not recommended. For aggregate queries with explicit bucketing — those that use thebucket()query functions — use a scheduled search. In all other cases, opt for a filter alert or an aggregate alert instead. Legacy alerts do not offer backfills, and therefore are not resilient against ingest delays.Legacy alerts have the following attributes and behavior:
An alert is triggered only when the query returns one or more results.
All the values within the result set from the query are available when triggering an action.
Events matching an aggregate query can also be sent to Actions. See Send aggregate results to actions.
Throttling is required for Legacy alerts to prevent the query triggering a configured action too often or too frequently. See Throttling for legacy alerts.
The environment variable
ENABLE_ALERTSmust be set totrueon every host in the cluster.Consider the limitations explained in Errors when Using Live join() Functions when using Join Query Functions in Legacy alerts.
If an alert query is not executing it is recommended to disable the alert, wait for one minute, and then enable the alert again. This will "reset" the alert to only run from now on and not retry any missed data.
The following are known limitations for Legacy alerts:
If an error occurs, Legacy alerts keep running, so when they eventually succeed, it will be for a different search interval and possibly a different result.
When throttling, the next search after a Legacy alert triggers does not start exactly when the throttle period ends, which means that events right before or after might be missed.
For improved reliability, these limitations have been addressed in Aggregate alerts and Scheduled searches.
Timestamp for legacy alerts
Legacy alert queries run on @timestamp. For more information about timestamps, see Which timestamp to use for trigger.
Time window for legacy alerts
When setting the time window for legacy alerts, remember the following:
If the legacy alert is aggregating events, the time window should match the time period you want to aggregate over.
If the legacy alert is correlating events, the time window should be large enough for all events that should be correlated with each other to be within the time window.
If the legacy alert is finding single events, the time window can be kept small, down to 1 minute.
Ingest delay handling for legacy alerts
Legacy alerts always run on @timestamp and are affected by ingest delay both inside and outside of LogScale. Ingest delay must be handled manually.
Throttling for legacy alerts
Throttling is required for legacy alerts. For general information about throttling, see Throttling.
General throttling
General throttling means that if the legacy alert triggers, then it does not trigger again until the throttle period is over. So if a legacy alert triggers at 13:24 and has a throttle period of 1 hour, then it does not trigger again until 14:24 at the earliest and ignores all query results in the meantime.
The diagrams below show an example with five runs of an aggregate alert. In the first run, the alert query did not have any result, so the query is checked again shortly after, again with no result.
The third time, the alert query has results, so the alert triggers, and a throttle period (red line) is put in place.
That means that whenever the alert query is checked within the throttle period, nothing happens if the alert query produces a result.
Only after the throttle period is over, the result of the alert query is again being evaluated.
Field-based throttling
Field-based throttling means that if the alert triggers on a query result with events with values 1 and 2 for the throttle field at 13:24, and then at 13:25 sees events with values 2 and 3 for the throttle field, then it will remove the events with value 2 from the query result before executing the action(s). It will only stop filtering events with values 1 and 2 at 14:24 and events with value 3 at 14:25. If it sees a query result where all the events are filtered out, it will not trigger.
Relation between throttle period and time window in Legacy alerts
If your search finds specific events on which you want to trigger a Legacy alert, for example specific errors, you want to set the throttle period to match the time window of the search. If you set the throttle period higher than the time window, you might miss events, and if you set it lower, you might get duplicate alerts.
If your search involves an aggregate, you might want to set the time window larger in some cases. For example, you want to be notified every hour if there are more than 5 errors within a 4 hour search window. You probably do not want to set the time window smaller than the throttle period, as this means that there will be events that are never evaluated by the alert. For Actions like Email and Slack, you want a higher throttle period since these triggers do not deduplicate.
Query warnings for legacy alerts
In case of query warnings, legacy alerts will not fail. Query warnings are:
Warnings that are logged and reported in the status of the alert, but otherwise continue despite.
Warnings that are treated as errors, since they mean that the result can be completely wrong.
The humio-activity repository lists all activity logs with a suggestion of how to resolve the issue depending on the level of severity, see Legacy Alert Errors and Solutions for more information.