
Time Chart Widget
The Time Chart widget is LogScale's
primary visualization tool for temporal data analysis, displaying bucketed
time series data along a timeline. It aggregates and visualizes data
points across specified time intervals (buckets), making it ideal for
tracking trends, patterns, and anomalies over time.
Figure 250, “Time Chart” show an example of the widget's appearance.
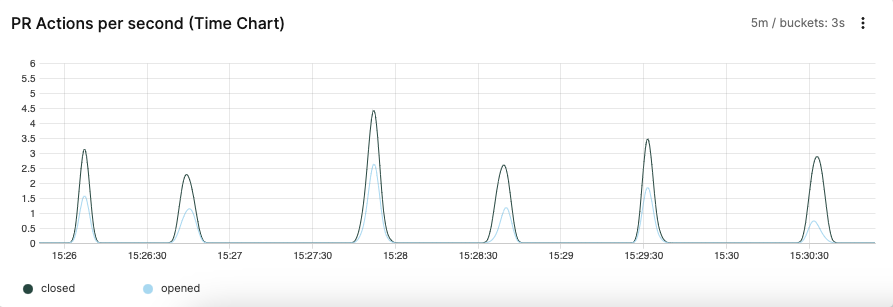 |
Figure 250. Time Chart
Key features:
Multiple metric display — for example, can display CPU usage and network traffic all plotted on the same chart with different colors/lines
Real-time data updates
Precise value and timestamp display on hover (see Figure 251, “Bucket values and times shown on hover”)
Zoom selection: click and drag across any portion of the chart to zoom into that specific time period
Interactive legend with series toggle
Turn on/off multiple overlapping series, see Hint: Deselect Series in Widgets
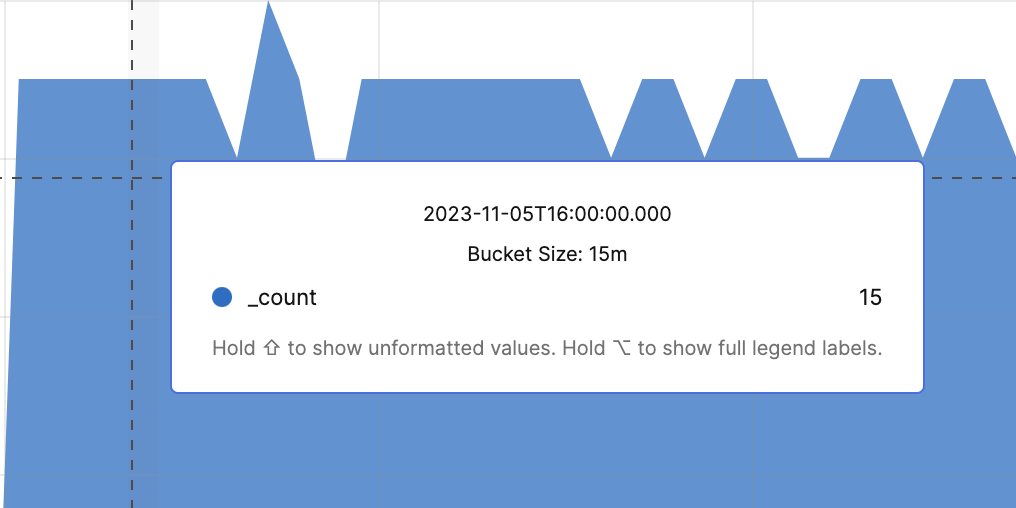 |
Figure 251. Bucket values and times shown on hover
Review these sections for Time Chart widget
details: