
Counts the number of events in the repository, or streaming through the function. You can use this field name to pipe the results to other query functions or general use.
It's possible to specify a field and only events containing that field are counted. It's also possible to do a distinct count. When having many distinct values LogScale will not try to keep them all in memory. An estimate is then used, so the result will not be a precise match.
| Parameter | Type | Required | Default Value | Description |
|---|---|---|---|---|
as | string | optional[a] | _count | The name of the output field. |
distinct | boolean | optional[a] | When specified, counts only distinct values. When this parameter is set to true, LogScale always uses an estimate, which may give an inexact result as the value. | |
field[b] | string | optional[a] | The field for which only events are counted. | |
[a] Optional parameters use their default value unless explicitly set. | ||||
Hide omitted argument names for this function
Omitted Argument NamesThe argument name for
fieldcan be omitted; the following forms of this function are equivalent:logscale Syntaxcount("value")and:
logscale Syntaxcount(field="value")These examples show basic structure only.
Accuracy When Counting Distinct Values
When counting distinct values in a data stream, particularly when there are repeated elements in a limited memory environment, limitations exist in the accuracy of the count to avoid consuming too much memory in the process. For example, if counting 1,000,000 (million) events. If each event contains a different value, then memory is required to store the count for each of those million entries. Even if the field is only 10 bytes long, that is approximate 9MB of memory required to store the state. In LogScale, this affects the limits as outlined in State Sizes and Limits. As noted in that section, LogScale uses an estimation algorithm that produces an estimate of the number of distinct values while keeping the memory usage to a minimum.
While the algorithm in question doesn't give any guarantees on the relative error of the reported result, the typical accuracy (standard error) is less than 2%, with 2/3s of all results being within 1%, tests with up to 10^7 distinct values, the result at worst deviated by less than 0.02%. The worst results for each test can be seen in the table below:
| Distinct Values | Result of distinct count | Deviation percentage |
|---|---|---|
| 10 | 10 | 0 |
| 100 | 100 | 0 |
| 1000 | 995 | -0.005025125628 |
| 10000 | 10039 | 0.003884849089 |
| 100000 | 100917 | 0.009086675189 |
| 1000000 | 984780 | -0.01545522858 |
| 10000000 | 10121302 | 0.01198482172 |
Important
For less than 100 distinct values, the deviation percentage will be exacerbated. For example, if there are only 10 distinct values, a deviation of 1 is 10%, even though it is the smallest possible deviation from the actual number of distinct values.
More typically, values used for aggregations or counts for distinct values will have low cardinality (for example, a small number of distinct values against the overall set).
count() Syntax Examples
Below are several examples using the
count() function. Some are simple and
others are more complex, with functions embedded within
others.
Count All Events
This a simple example using the
count() function. The query just
counts the number of events found in the repository for
the period of time selected:
count()The result is just a single number, the total count.
| _count |
|---|
| 3886817 |
To format adding a thousands separator:
count()
| format("%,i", field=_count, as=_count)
Produces
| _count | |
|---|---|
| 3 | 886,817 |
Group & Count
In this example, the query uses the
count() function within the
groupBy() function. The first
parameter given is the field upon which to group the data.
In this case, it's the HTTP method (for example,
GET,
PUT,
POST). The second parameter says
to use the function count() to count
the number occurrences for each method found.
groupBy(field=method, function=count())The result is a table with the column headings, method and _count, with the values for each:
| method | _count |
|---|---|
| DELETE | 7375 |
| GET | 153493 |
| POST | 31654 |
Chart of Daily Counts
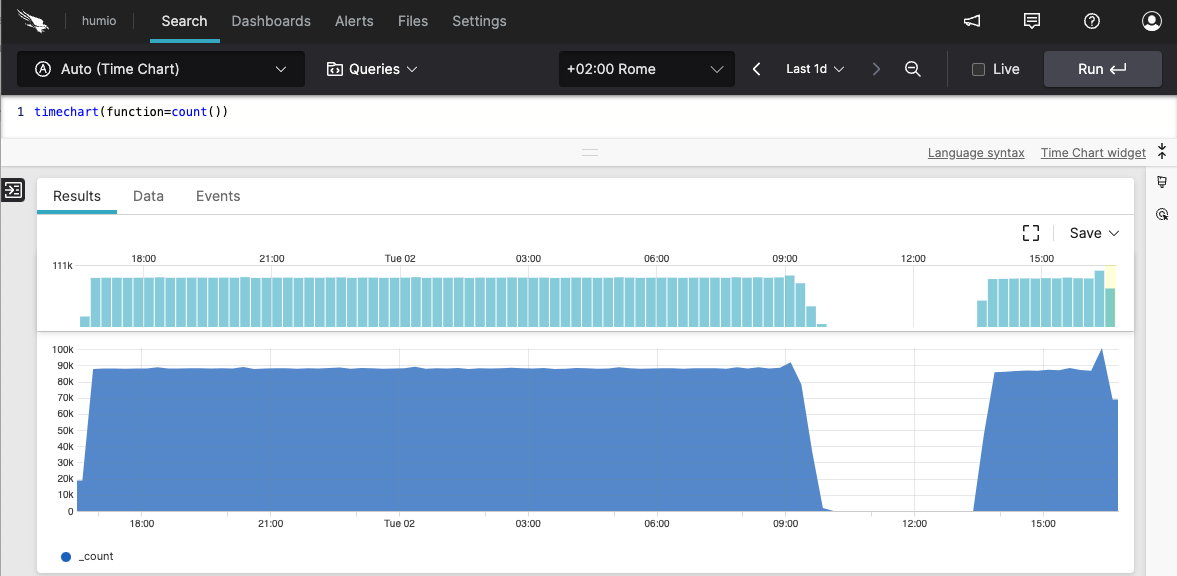 |
Figure 151. count() Chart of Daily Counts
You can use the count() function in
conjunction with the timeChart()
function to count the number occurrences of events or
other factors. By default, the
timeChart() function will aggregate
the data by day. The results will look something like what
you see in the screenshot shown in
Figure 151, “count() Chart of Daily Counts”.
timeChart(function=count())Table of Daily Counts
When a user accesses a web site, the event is logged with
a status. For instance, the status code
200 is returned when the
request is successful, and
404 when the page is not
found. To get a list of status codes returned and a count
of each for a given period, you would enter the following
query in the
Search box:
groupBy(field=status, function=count())The sample output is shown below:
| status | _count |
|---|---|
| 101 | 9 |
| 200 | 55258 |
| 204 | 137834 |
| 307 | 2 |
| 400 | 2 |
| 401 | 4 |
| 403 | 57 |
| 404 | 265 |
| 504 | 62 |
| stopping | 6 |
| success | 6 |
count() Examples
Click next to an example below to get the full details.
Aggregate Status Codes by count() Per Minute
Time series aggregate status codes by count()
per minute into buckets
Query
bucket(1min, field=status_code, function=count())Introduction
In this example, the bucket() function is used with
count() to count different HTTP status codes over
time and bucket them into time intervals of 1 minute.
Step-by-Step
Starting with the source repository events.
- logscale
bucket(1min, field=status_code, function=count())Counts different HTTP status codes over time and buckets them into time intervals of 1 minute. Notice that we group by two fields: status_code field and the implicit field _bucket.
Event Result set.
Summary and Results
The query is used to optimizing data storage and query performance.
Bucketing allows for data to be collected according to a time range.
Using the right aggregation function to quantify the value groups that
information into the buckets suitable for graphing for example with a
Bar Chart, with the size of the bar using
the declared function result, count() in this
example.
Aggregate Status Codes by count() Per Minute
Time-based event counting with default buckets using the
bucket() function
Query
bucket(1min, field=status_code, function=count())Introduction
Counts different HTTP status codes over time and buckets them into time intervals of 1 minute. Notice we group by two fields: status code and the implicit field _bucket.
Step-by-Step
Starting with the source repository events.
- logscale
bucket(1min, field=status_code, function=count())Sets the bucket interval to 1 minute, aggregating the count of the field status_code.
Event Result set.
Summary and Results
Bucketing allows for data to be collected according to a time range. Using
the right aggregation function to quantify the value groups that
information into the buckets suitable for graphing for example with a
Bar Chart, with the size of the bar using
the declared function result, count() in this
example.
Bucket Events Summarized by count()
Summarize events into buckets across selected timespan using the
count() function
Query
bucket(function=count())Introduction
Divides the search time interval into buckets. As time span is not specified, the search interval is divided into 127 buckets. Events in each bucket are counted:
Step-by-Step
Starting with the source repository events.
- logscale
bucket(function=count())Summarizes events using
count()into buckets across the selected timespan. Event Result set.
Summary and Results
This query organizes data into buckets according to the count of events.
Calculate Events per Second by Host
Determine event rate for each host over a 5-minute period using an
embedded expression within the groupBy()
function
Query
groupBy(host, function=[{count() | esp:=_count/300}])Introduction
In this example, the groupBy() function is used
with an embedded expression to calculate the total event count and
events per second for each host over a 5-minute period.
Example incoming data might look like this:
| @timestamp | host | service | status | response_time |
|---|---|---|---|---|
| 2025-08-06T10:00:00Z | server1 | web | ok | 120 |
| 2025-08-06T10:00:01Z | server2 | database | ok | 85 |
| 2025-08-06T10:00:02Z | server1 | web | ok | 95 |
| 2025-08-06T10:00:03Z | server3 | cache | ok | 45 |
| 2025-08-06T10:00:04Z | server2 | database | error | 250 |
| 2025-08-06T10:00:05Z | server1 | web | ok | 110 |
| 2025-08-06T10:00:06Z | server3 | cache | ok | 40 |
| 2025-08-06T10:00:07Z | server2 | database | ok | 90 |
| 2025-08-06T10:00:08Z | server1 | web | error | 300 |
| 2025-08-06T10:00:09Z | server3 | cache | ok | 42 |
Step-by-Step
Starting with the source repository events.
- logscale
groupBy(host, function=[{count() | esp:=_count/300}])Groups events by the host field and uses an embedded expression to count the number of events per host and calculate events per second in one operation.
The
count()function returns the count in a field named _count by default. The embedded expression then divides this value by300and stores the result in a new field named esp. This calculation provides the average events per second for each host over the time period.Using an embedded expression within the
groupBy()function performs both the count and the calculation as part of the same aggregation. Both the original _count and the calculated esp field are included in the results. Event Result set.
Summary and Results
The query is used to analyze event frequency patterns by calculating both the total event count and the average events per second for each host.
Note that the query aggregates against both the original count and the count/300 as one aggregate set. Using an embedded expression is more efficient for larger event sets.
This query is useful, for example, to monitor system load distribution across hosts, identify hosts with unusual event rates, or establish baseline activity patterns for capacity planning.
Sample output from the incoming example data:
| host | _count | esp |
|---|---|---|
| server1 | 4 | 0.013333 |
| server2 | 3 | 0.010000 |
| server3 | 3 | 0.010000 |
Note that the _count field shows the total number of events per host, and the esp field shows the calculated events per second (total events divided by 300 seconds)
This data is ideal for visualization using a Time Chart widget to show event rates over time. A Bar Chart widget could compare event rates across hosts, while a Gauge widget could show current event rates against predefined thresholds. Consider creating a dashboard that combines these visualizations with alerts for when event rates exceed normal ranges.
Count Total of Malware and Nonmalware Events
Count total of malware and nonmalware events in percentage
Query
[count(malware, as=_malware), count(nonmalware, as=_nonmalware)]
| total := _malware + _nonmalware
| nonmalware_pct_total := (_nonmalware/total)*100
| malware_pct_total := (_malware/total)*100
Introduction
It is possible to use the count() function to
show the count in percentage of two fields against total. In this
example, the function count() function is
used to count the field
malware and the field
nonmalware and have the
results returned in percentage. A result set could, for example,
be normalware 30% and nonmalware 70%.
Step-by-Step
Starting with the source repository events.
- logscale
[count(malware, as=_malware), count(nonmalware, as=_nonmalware)]Returns the counted results of the field malware in a field named _malware and the counted results of the field nonmalware in a field named _nonmalware.
- logscale
| total := _malware + _nonmalwareAssigns the total of these events to a new field named total.
- logscale
| nonmalware_pct_total := (_nonmalware/total)*100
| malware_pct_total := (_malware/total)*100
Calculates the _malware and _nonmalware as a percentage of the total.
Event Result set.
Summary and Results
The query is used to get an overview of the total number of malware versus nonmalware.
Get List of Status Codes
Get list of status codes returned and a count of each for a given
period using the groupBy() function with
count()
Query
groupBy(field=status, function=count())Introduction
In this example, the groupBy() function is used to
get a list of status codes for logged events. For instance, the status
code 200 is returned when the request is
successful, and 404 when the page is not
found.
Step-by-Step
Starting with the source repository events.
- logscale
groupBy(field=status, function=count())Groups events by the status field, and counts the number of events in each group.
It is possible to enhance the query for more detailed analysis. The following query example groups by both the fields status and source, limits to 1000 results, and sorts by count descending.
groupBy([field=status, field=source],
          function=count(), limit=1000) | sort(_count, order=desc)
Event Result set.
Summary and Results
The query is used to extract a list of status codes, each with a count of how many events have that status. The query is useful for summarizing and analyzing log data.
Sample output from the incoming example data:
| status | _count |
|---|---|
| 101 | 17 |
| 200 | 46183 |
| 204 | 3 |
| 307 | 1 |
| 400 | 2893 |
| 401 | 4 |
| Failure | 1 |
| Success | 8633 |
Group HTTP Methods and Count Status Codes
Analyze HTTP traffic patterns using nested
groupBy() function
Query
groupBy(method, function=[count(as=method_total),
        groupBy(statuscode, function=count(as=method_status_count))])
Introduction
In this example, the groupBy() function is used to
analyze HTTP traffic patterns by grouping requests first by HTTP method
and then by status code, providing counts at both levels.
Example incoming data might look like this:
| @timestamp | method | statuscode | path | bytes |
|---|---|---|---|---|
| 2025-08-06T10:00:00Z | GET | 200 | /index.html | 1024 |
| 2025-08-06T10:00:01Z | POST | 201 | /api/users | 512 |
| 2025-08-06T10:00:02Z | GET | 404 | /missing.html | 256 |
| 2025-08-06T10:00:03Z | GET | 200 | /about.html | 768 |
| 2025-08-06T10:00:04Z | POST | 400 | /api/users | 128 |
| 2025-08-06T10:00:05Z | PUT | 200 | /api/users/1 | 896 |
| 2025-08-06T10:00:06Z | GET | 200 | /contact.html | 645 |
| 2025-08-06T10:00:07Z | POST | 201 | /api/orders | 789 |
| 2025-08-06T10:00:08Z | GET | 404 | /old-page.html | 234 |
| 2025-08-06T10:00:09Z | DELETE | 204 | /api/users/2 | 0 |
Step-by-Step
Starting with the source repository events.
- logscale
groupBy(method, function=[count(as=method_total),
        groupBy(statuscode, function=count(as=method_status_count))])
Groups events first by the method field and performs two functions:
Event Result set.
Summary and Results
The query is used to analyze HTTP traffic patterns by providing a hierarchical view of request methods and their associated status codes.
This query is useful, for example, to identify patterns in API usage, detect potential issues with specific HTTP methods, or monitor the distribution of success and error responses across different request types.
Sample output from the incoming example data:
| method | method_total | statuscode | method_status_count |
|---|---|---|---|
| GET | 5 | 200 | 3 |
| GET | 5 | 404 | 2 |
| POST | 3 | 201 | 2 |
| POST | 3 | 400 | 1 |
| PUT | 1 | 200 | 1 |
| DELETE | 1 | 204 | 1 |
Note that the output shows both the total count per method (method_total) and the breakdown of status codes (method_status_count) within each method, providing a comprehensive view of the HTTP traffic distribution.
This data would be effectively visualized using a Sankey diagram widget to show the flow from HTTP methods to status codes, or a nested pie chart to display the distribution.
Group HTTP Methods and Status Codes Using Nested
groupBy()
Analyze HTTP traffic patterns by method and status code using the
groupBy() function
Query
groupBy(method, function=[count(as=method_total), groupBy(statuscode, function=count(as=method_status_count))])Introduction
In this example, the groupBy() function is used to
analyze HTTP traffic patterns by grouping requests first by HTTP method
and then by status code within each method.
Example incoming data might look like this:
| @timestamp | method | statuscode | path | bytes |
|---|---|---|---|---|
| 2025-08-06T10:00:00Z | GET | 200 | /index.html | 1024 |
| 2025-08-06T10:00:01Z | POST | 201 | /api/users | 512 |
| 2025-08-06T10:00:02Z | GET | 404 | /missing.html | 256 |
| 2025-08-06T10:00:03Z | GET | 200 | /about.html | 768 |
| 2025-08-06T10:00:04Z | POST | 400 | /api/users | 128 |
| 2025-08-06T10:00:05Z | PUT | 200 | /api/users/1 | 384 |
| 2025-08-06T10:00:06Z | GET | 200 | /contact.html | 896 |
| 2025-08-06T10:00:07Z | DELETE | 204 | /api/users/2 | 0 |
| 2025-08-06T10:00:08Z | GET | 500 | /error.html | 1024 |
| 2025-08-06T10:00:09Z | POST | 201 | /api/orders | 756 |
Step-by-Step
Starting with the source repository events.
- logscale
groupBy(method, function=[count(as=method_total), groupBy(statuscode, function=count(as=method_status_count))])Groups events by the method field and performs two aggregations:
Event Result set.
Summary and Results
The query is used to analyze HTTP traffic patterns by providing a hierarchical view of request methods and their associated status codes.
This query is useful, for example, to identify patterns in API usage, detect potential issues with specific HTTP methods, or monitor the distribution of success and error responses across different request types.
Sample output from the incoming example data:
| method | method_total | statuscode | method_status_count |
|---|---|---|---|
| GET | 5 | 200 | 3 |
| GET | 5 | 404 | 1 |
| GET | 5 | 500 | 1 |
| POST | 3 | 201 | 2 |
| POST | 3 | 400 | 1 |
| PUT | 1 | 200 | 1 |
| DELETE | 1 | 204 | 1 |
Note that the output shows the total count for each HTTP method in method_total and a breakdown of status codes and their counts within each method in method_status_count.
This data is well-suited for visualization using a Sankey diagram widget, which can effectively show the flow from HTTP methods to status codes.