
Display Results and Events
LogScale presents the data returned from a search in a list format. By default, this list includes the @timestamp and @rawstring columns, plus any columns selected in the Fields panel.
Unicode control characters (C0, C1, and DEL ranges) are rendered as visible placeholders in the event display, improving visibility when inspecting logs that contain binary data, terminal output, or other data with control characters.
Display tabs
Depending on the contents and functions used in the query, different tabs for displaying output data appear based on the query, for example if the query includes Aggregate Query Functions. Available tabs are:
Source Events tab that contains all filtered events
Auto() visualization selection tab
It automatically selects the best visualization for your query results based on data type and structure (for example,
TableorPie Chart). This tab presents the final results after all the elements of the source query, including filters and aggregations such asgroupBy(), have been completed.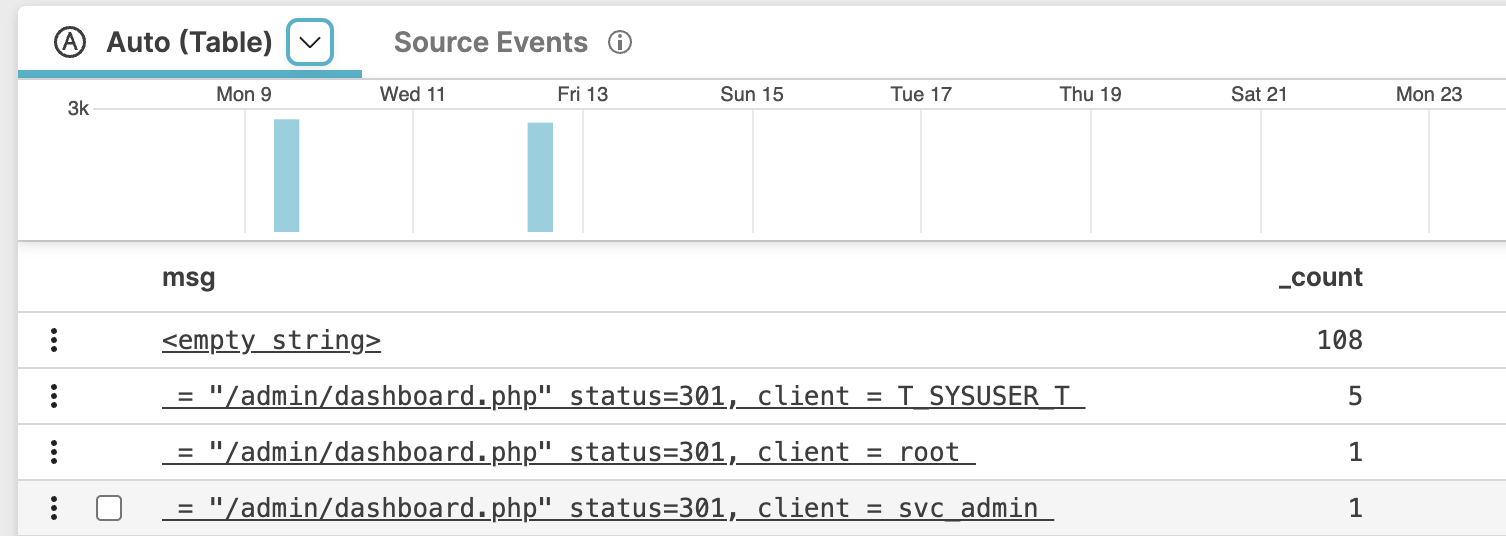
Different forms of the Auto() tab may be available in different contexts:
Auto() tab grouped by prefix
When using a query prefix, for example with the
correlate()function, the results will be shown grouped by the name of the prefix query. When grouping in this format, each result is set for a givencorrelate()query.For example:
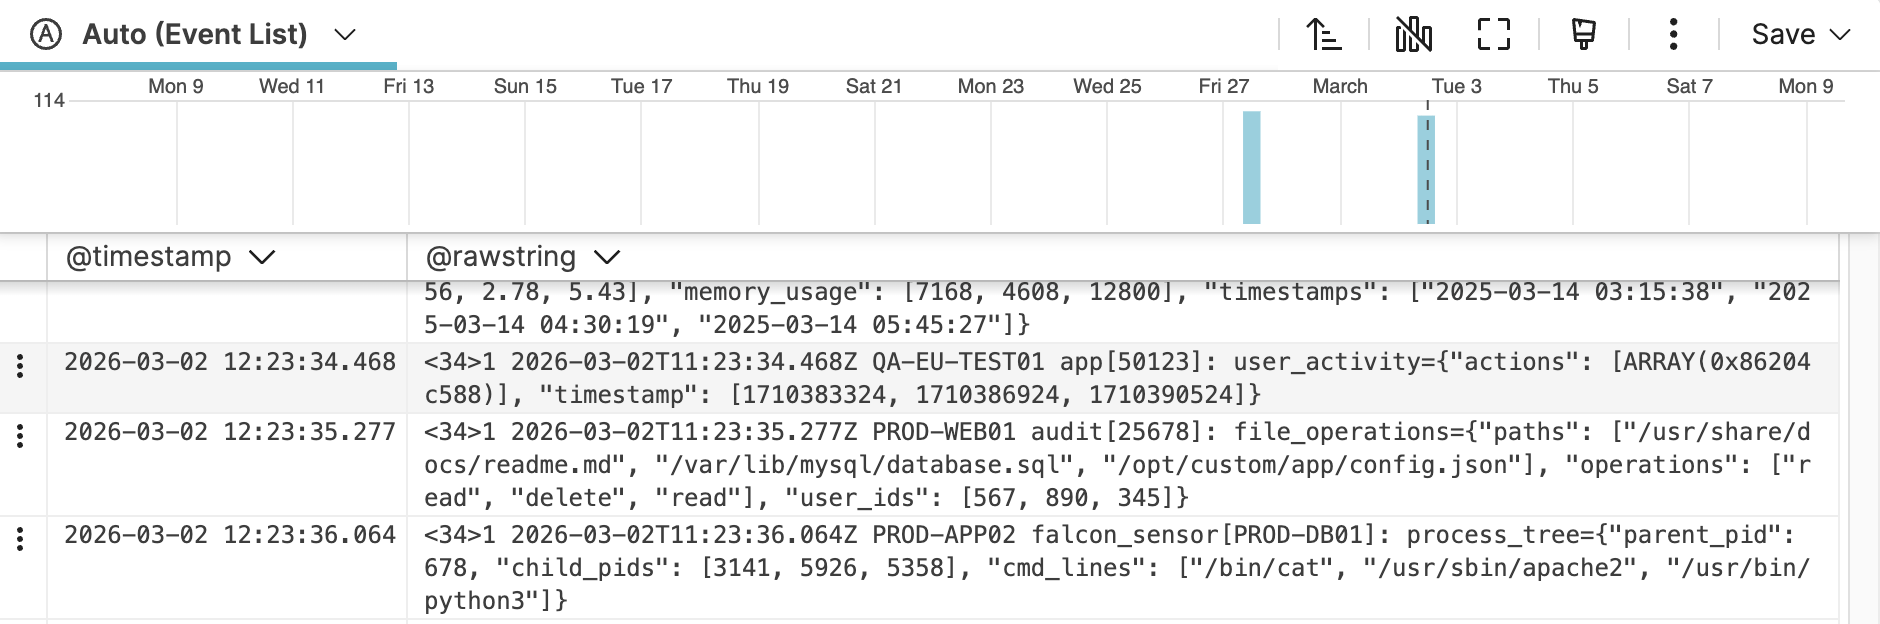
Event List tab
It is the event list that displays the results of a query. For queries without a prefix, this tab includes the raw event data after matches and filtering, but before aggregation.
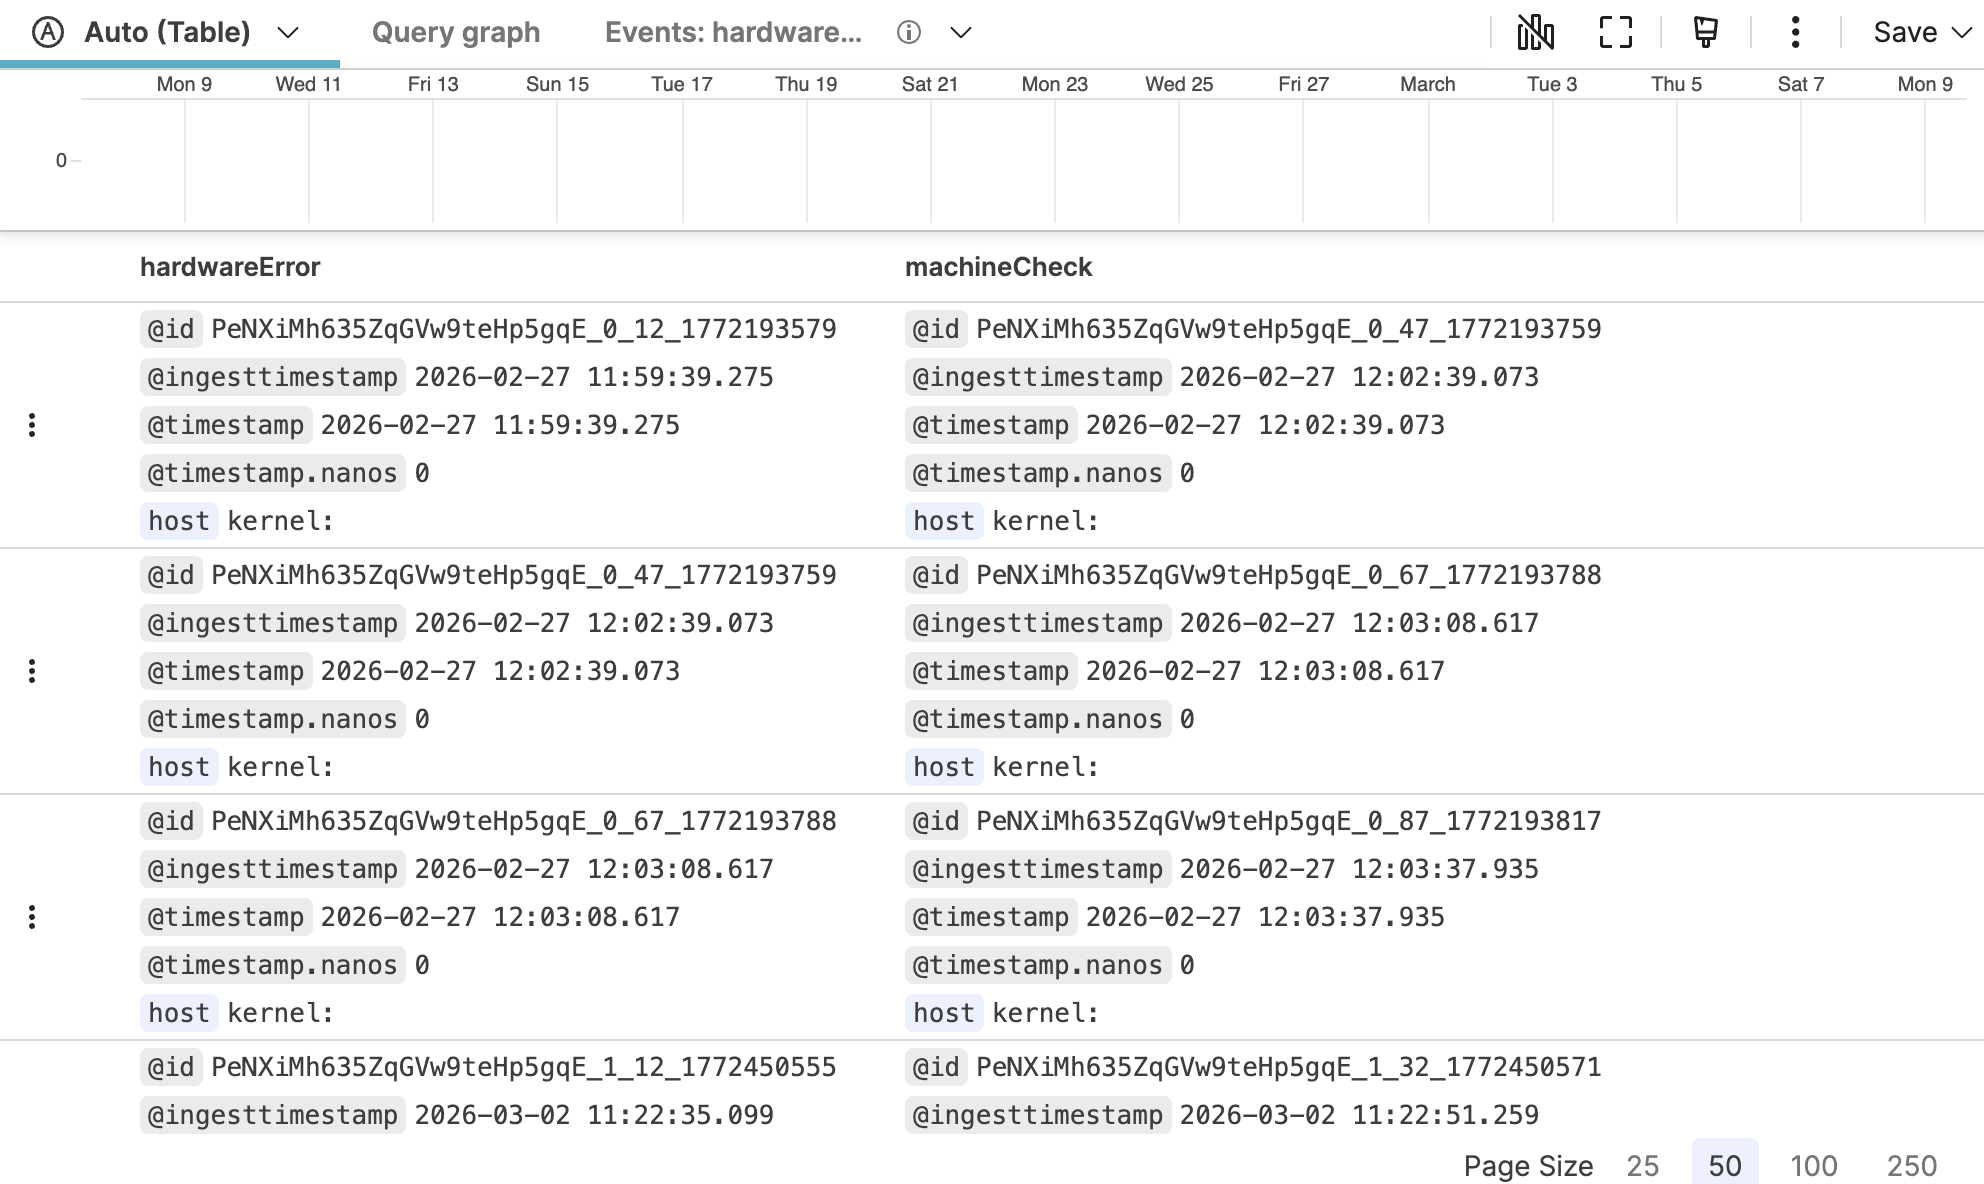
Named Prefix Events tab
When using
correlate(), matching event sets for each named query are available as separate tabs, one per prefix used within thecorrelate()function. Each event tab will contain the events matching each named query in thecorrelate()definition, including the raw event data after matches and filtering, but before aggregation. When grouping in this format, each result is set for a givencorrelate()query.For example, the
correlate()function in this query has two named queries,machineCheckandhardwareErrorwhich each have a tab of matching results: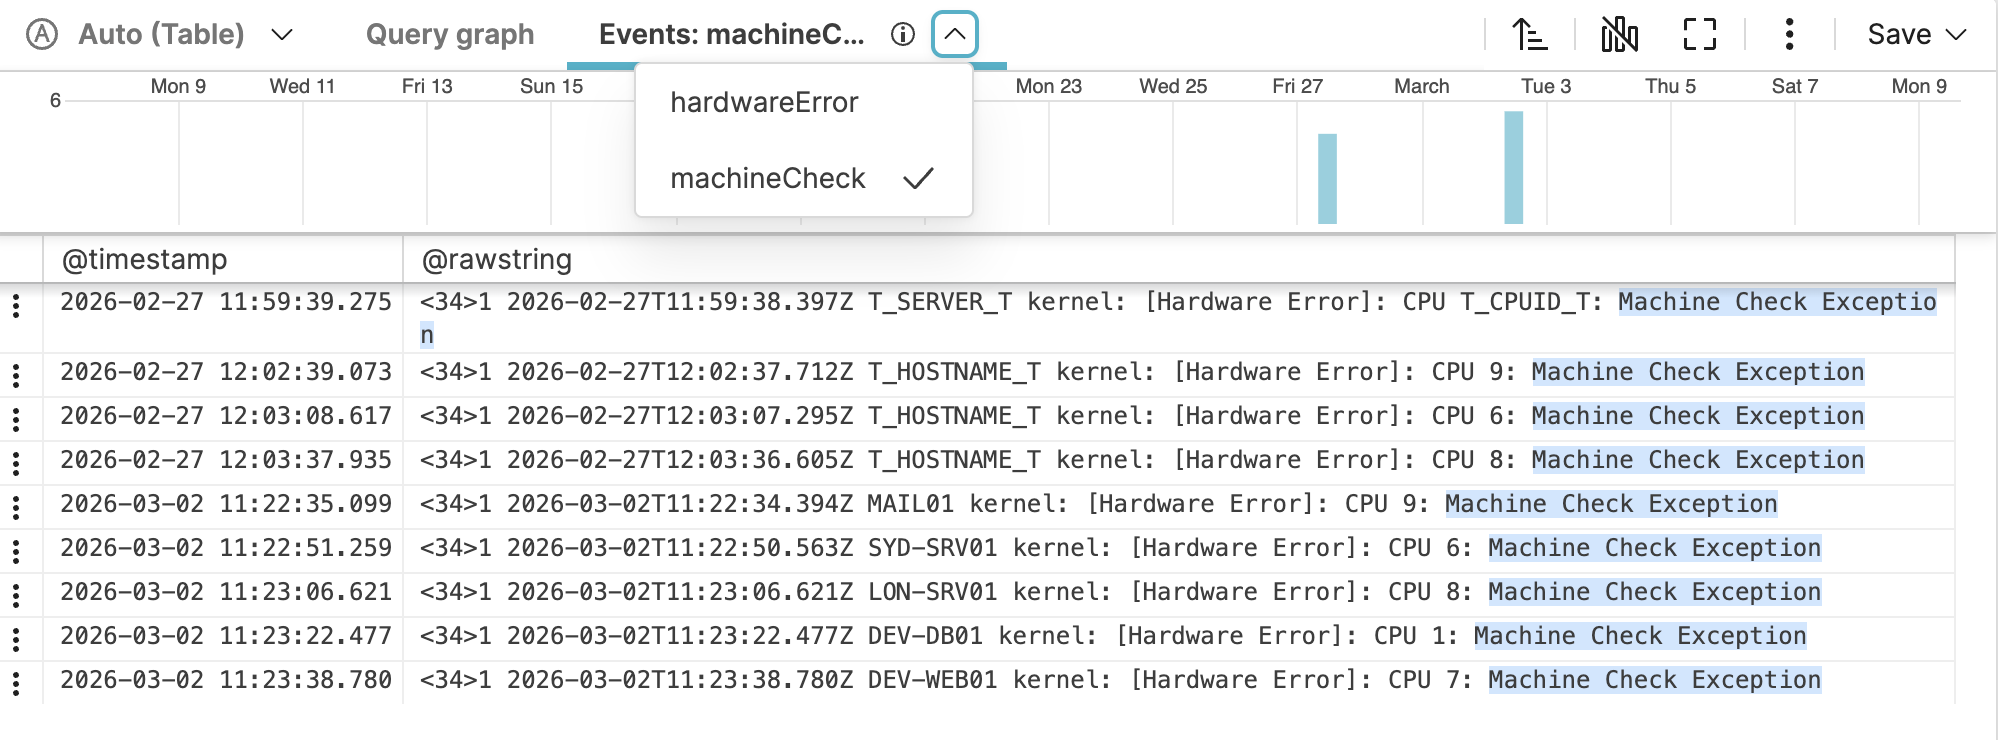
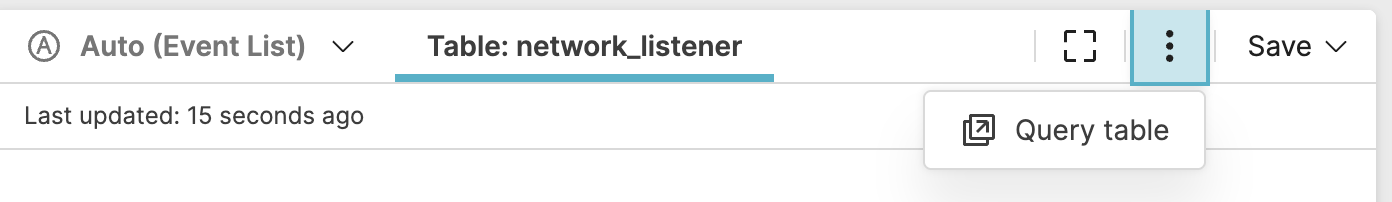
Table tab
Appears when the
defineTable()function is used in the source query, to display the results of the ad-hoc table defined by the function.Click the menu option to return to the query in the default Event List tab.
The display of matching entries for the table is limited to the first 500 rows. For more information, see How to Use Ad-hoc Tables in Queries.
From 1.242 Content in the Table tab is populated by accessing the table generated by the original query. This approach displays the information much quicker than executing an additional subquery on the table.
Query graph tab
Appears when the
correlate()function is used in the source query, to provide a graphical representation of two correlated events. The graph helps users author complex queries usingcorrelate(), as it displays the structure of the query including correlation query nodes and links that represent the relationship between event fields. For more information, seecorrelate().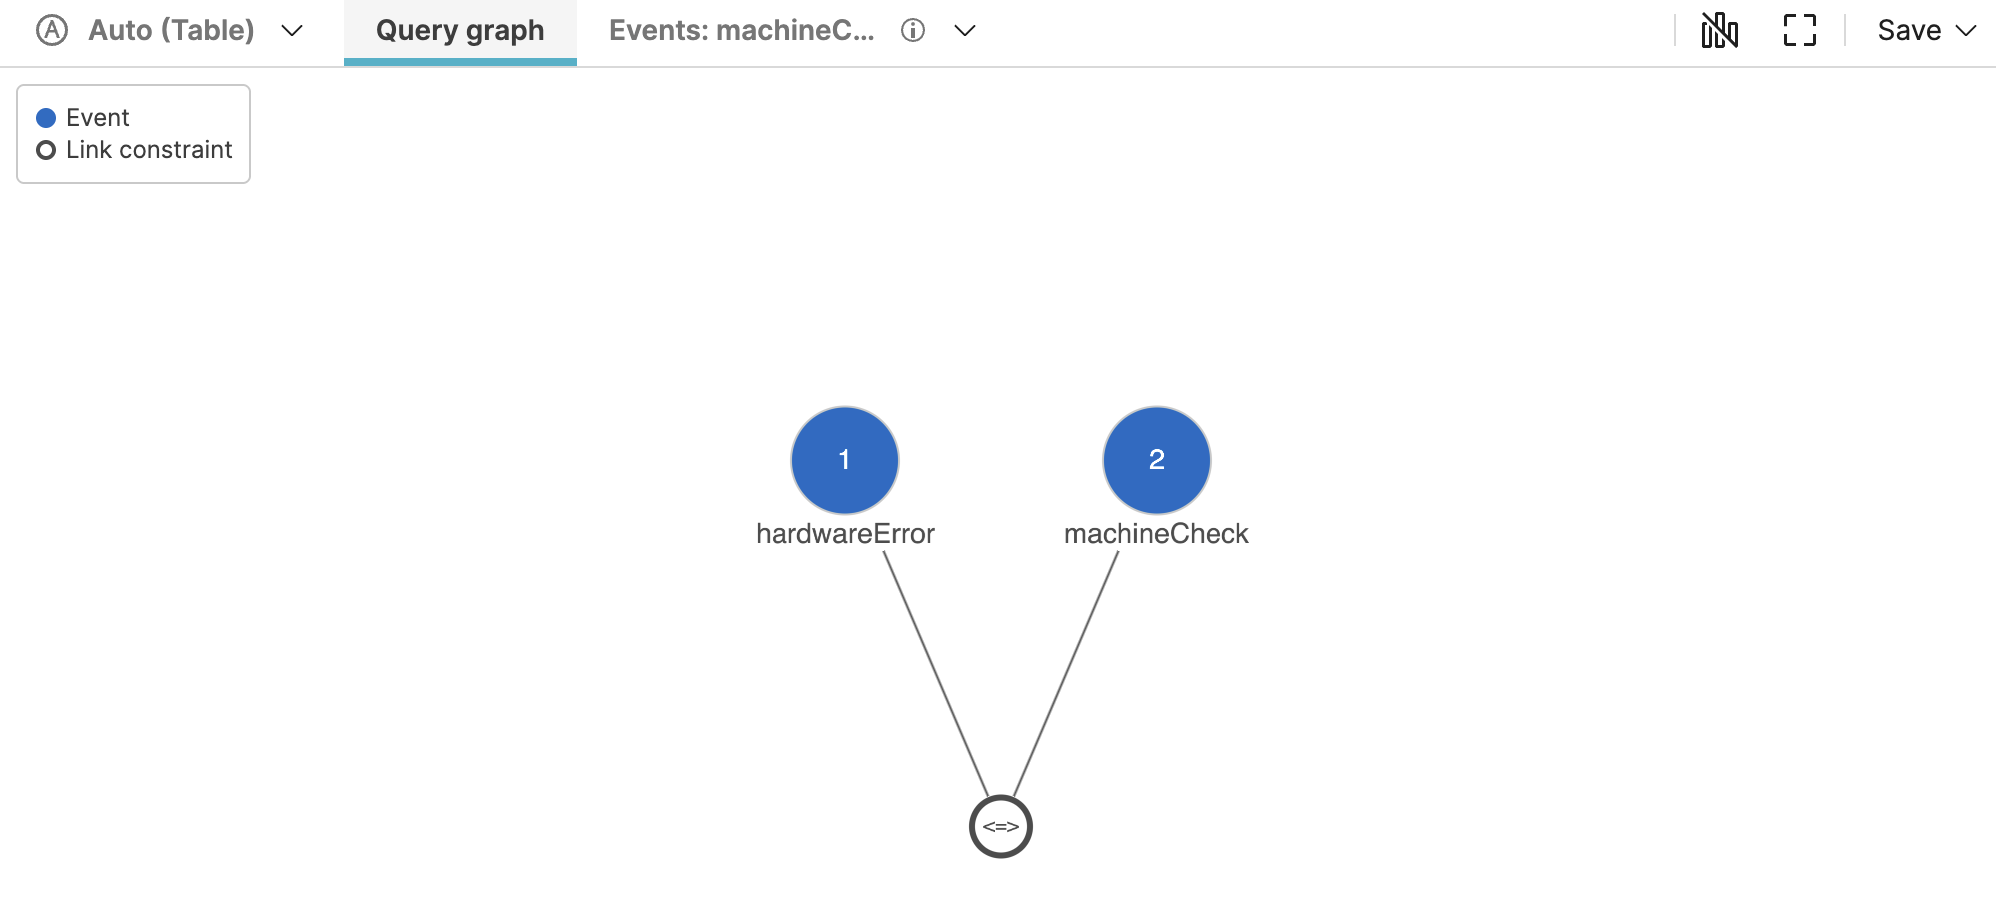
Display options
You can change the way events are displayed from the Tool panel above the Event List:
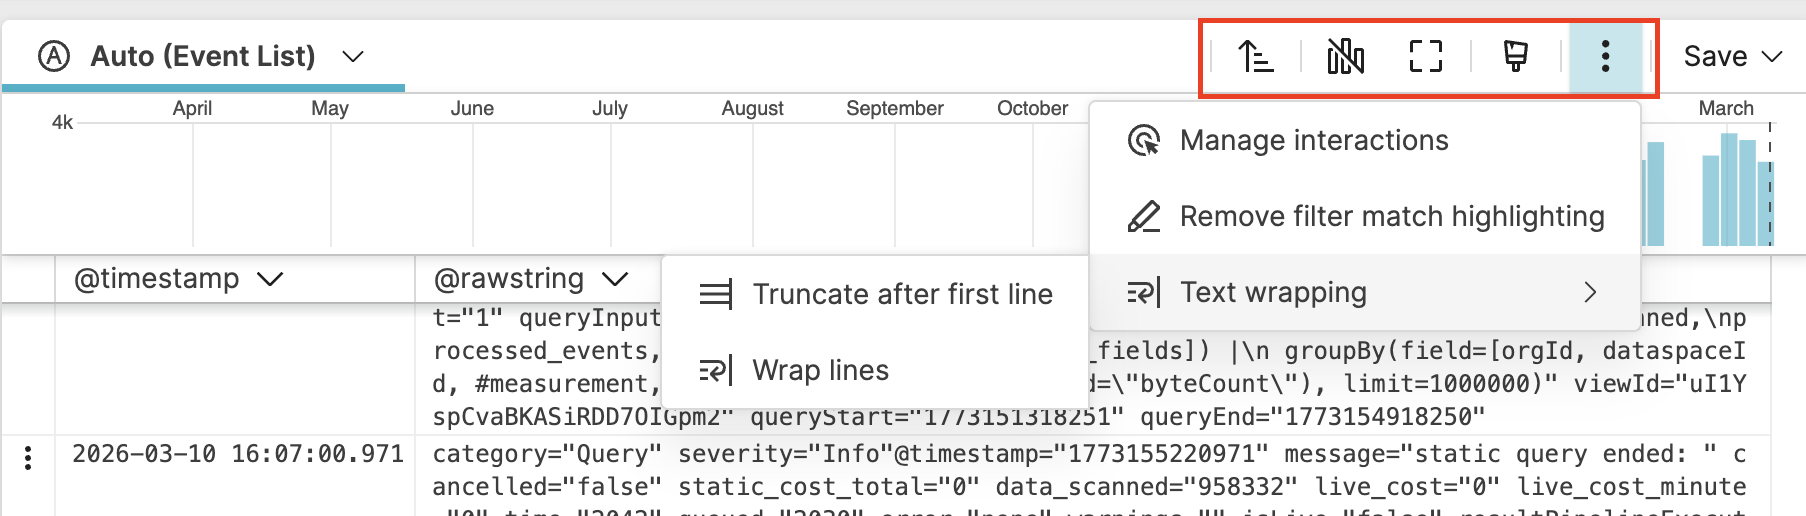 |
Figure 86. Tool Panel for Different Display Modes
The Tool Panel allows for these options:
The style icon opens the Format panel, see Manage Fields for more information.
Manage interactions provides access to Event List Interactions.
Filter match highlighting allows highlighting results based on the filters applied in queries. See Highlight Filter Match for more information.
scrolls to selected event to make it possible to scroll fields starting from a selected event.
Text wrapping is used to wrap lines or truncate fields after the first line.
changes the order of fields in the event. You can choose whether newest events appear at the bottom or top of the list.
allows hiding the event histogram to get more space when looking at data. The histogram provides a graphical representation of how many events occurred at different points in time. Hover over the bars to check events per bucket span; click on a bucket span to update the Event List and show only the events that occurred during that specific time interval.
toggles/untoggles fullscreen to display events in full-screen mode.