
Bar Chart Usage and Data Format
Bar charts can be of two types:
Single series. Displays one data series with individual bars representing single values.
Multiple series. Displays one or more metrics per category, or one metric broken down by two dimensions. For example, by severity and vendor name.
The following example use cases and variations apply.
| Bar Chart Type | Description | Use Case | Example |
|---|---|---|---|
| Single Series Bar Chart | Displays one data series with individual bars representing single values | Ideal for comparing single metrics across categories | Compare the number of detection events across different severity levels (Critical, High, Medium, Low). See Event Detection Across Severity Levels. |
| Multiple Series - Grouped Bars | Shows multiple data series side by side for each category | Compare multiple related sub-categories simultaneously | Compare failed and successful authentication attempts by department. See Failed and Successful Authentication Attempts. |
| Multiple Series - Stacked Bars | Bars are stacked on top of each other, showing both individual values (and their relation to totals) and totals | Display component parts of a whole while maintaining visibility of total values | Visualize threat types (Malware, Ransomware, Phishing) distribution within each time period. See Threat Type Distribution. |
| Multiple Series - 100% Stacked Bars | Similar to stacked bars but normalized to 100% to show proportion to total | Focus on proportional distribution rather than absolute values | Show the relative proportion of different alert types within each detection source. See Alert Type Proportion in Detection Sources. |
| Bar Chart with Line Overlay | Combines the chart with a line series to show related but different metrics | Compare volume metrics against trend indicators or averages | Display daily detection counts as bars with a line showing the moving average of detection severity. See Detection Counts with Severity Average. |
The Bar Chart widget maps data fields
based on the query result as the default behavior. This behavior can be
overwritten by manually mapping from fields in the query result to
visual properties, using the Data Mapping property.
For example, the default mapping assigns the first field from a
groupBy() query to the category axis. When multiple
fields define the category axis, the chart creates a category for each
unique value combination.
The Series definition property configures the chart to create multiple series from a single data table, with the following options:
With the default
Automode, the chart interprets query results to select eitherFieldsmode orField valuesmode.The chart activates
Field
              values
mode when the query contains multiple group fields, as ingroupBy([a,b]).In all other cases, the chart operates on
Fieldsmode.
In Field values mode, the chart
creates a series name for the unique value of a field column. A
secondary column determines the series values. When multiple fields
define the series names, the chart creates a series for each unique
value combination. Example:
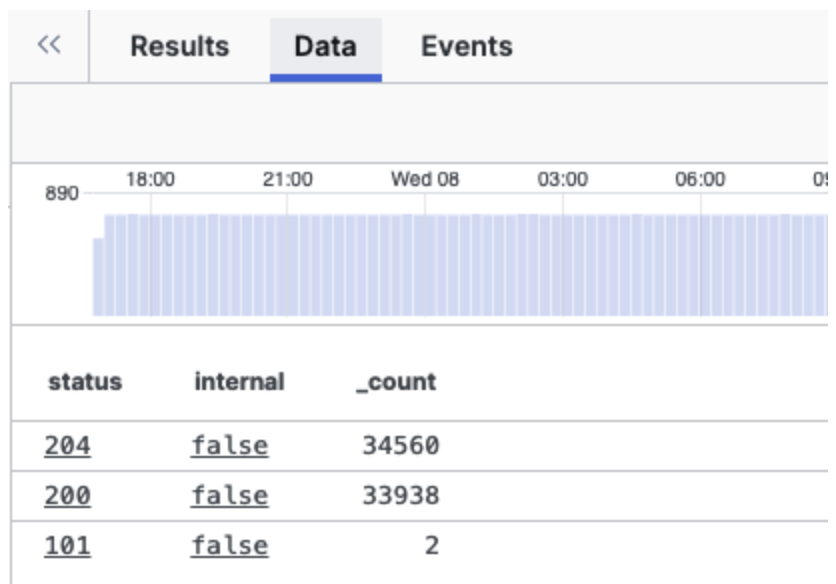 |
Figure 209. Field Values Mode View
In Fields mode, the chart creates a
series from each field column. The field name (column header) becomes
the series name, and the corresponding field values (cell values) become
the series values. Example:
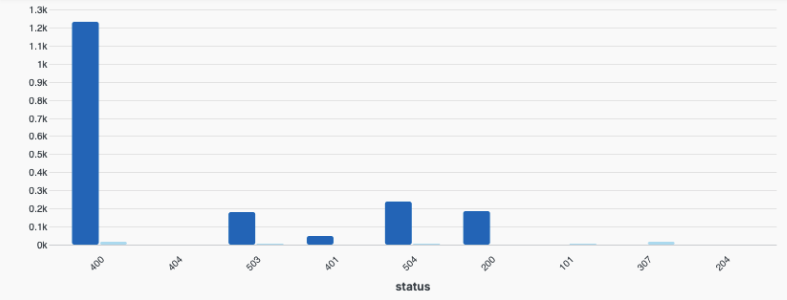 |
Figure 210. Fields Mode View