Dashboards & Widgets
Create Dashboards and Widgets to monitor and view your events in realtime
Security Requirements and Controls
Change dashboards
permission
An efficient and easy way to monitor event logs with LogScale is provided by dashboards. Based on frequently used searches, they're composed of Widgets that you create to view server activities in the form of various graphs and tables of relevant data.
From a dashboard, you can create various types of widgets, filter data, or use parameters to drill down to more specific results.
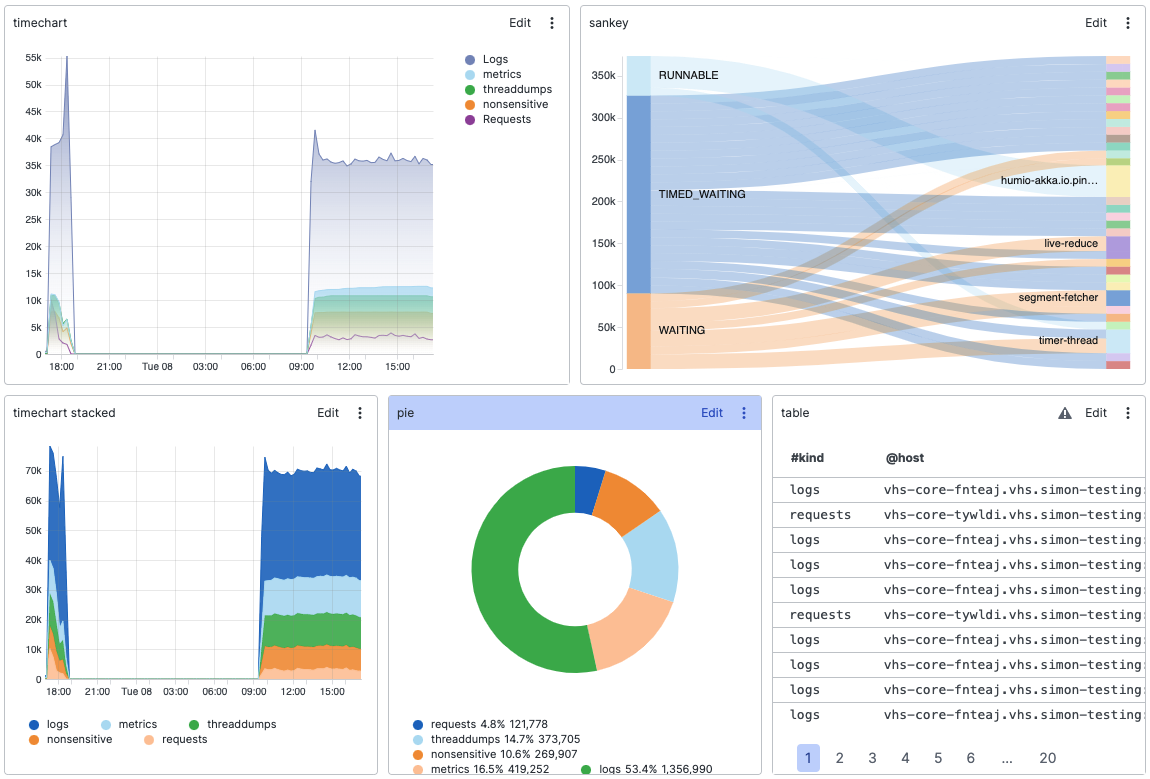
Find an example dashboard depicted in Figure 112, “LogScale Dashboard”:
![]() |
Figure 112. LogScale Dashboard
This section of the documentation provides information on how to use dashboards, how to create widgets, and how to customize them to suit your needs.
To start using dashboards, if you don't already have a dashboard, you'll need to create a new dashboard for your repository.
When you have a dashboard, you can use it to perform a series of operations. For example, you can grant access to others without allowing access to the data, by sharing the dashboard. Click on the heading here to see more on dashboards, or Sharing Dashboards for more on how to enable access to shared dashboards.
You may want to make various changes to your dashboards, such as editing labels, filtering data, or changing the time frame. Click on the heading here for more information.
A dashboard and its widgets can be based on parameters that can be adjusted from the dashboard. When something in a widget attracts your attention, having parameters in place will allow you to zoom in on the data.
When something in a dashboard gets your attention, you can explore it in more detail in a separate dashboard or external URL. Click on the heading here to learn more about interactions.
You'll need to create widgets for your dashboard. They're generally based on search queries you want to preserve. There are several types of widgets from which to choose — they're described on the linked page here.