
Rounds a numeric input field to the nearest integer, with an optional method to set the rounding type.
| Parameter | Type | Required | Default Value | Description |
|---|---|---|---|---|
as | string | optional[a] | Same name as input field | The output name of the field to round. |
field[b] | string | required | The names of the field to round. | |
how | string | optional[a] | round | Method used to round the number. |
| Values | ||||
ceil | Round up to the nearest whole number | |||
floor | Round down to the nearest whole number | |||
round | Standard rules; for example, <0.5 rounds down, >0.5 rounds up | |||
[a] Optional parameters use their default value unless explicitly set. | ||||
Hide omitted argument names for this function
Omitted Argument NamesThe argument name for
fieldcan be omitted; the following forms of this function are equivalent:logscale Syntaxround("value")and:
logscale Syntaxround(field="value")These examples show basic structure only.
round() Examples
Click next to an example below to get the full details.
Basic Rounding
Convert decimal numbers to nearest integers using the
round() function
Query
round(myvalue)Introduction
The round() function rounds a number to the
nearest integer (whole number) using standard math rules. Numbers
greater than 0.5 are rounded up, numbers lower than 0.5 are
rounded down.
Example incoming data might look like this:
| @timestamp | myvalue |
|---|---|
| 2025-11-05T10:00:00Z | 3.2 |
| 2025-11-05T10:00:01Z | 3.7 |
| 2025-11-05T10:00:02Z | 4.5 |
| 2025-11-05T10:00:03Z | 4.51 |
| 2025-11-05T10:00:04Z | 5.49 |
| 2025-11-05T10:00:05Z | 5.5 |
| 2025-11-05T10:00:06Z | -3.2 |
| 2025-11-05T10:00:07Z | -3.5 |
| 2025-11-05T10:00:08Z | -3.7 |
Step-by-Step
Starting with the source repository events.
- logscale
round(myvalue)Rounds the number in myvalue.
Event Result set.
Summary and Results
The query is used to round a floating point number to the nearest integer. Rounding is used to simplify numbers. The benefit to rounding is that it returns numbers that are easier to work with.
Sample output from the incoming example data:
| @timestamp | myvalue |
|---|---|
| 2025-11-05T10:00:00Z | 3 |
| 2025-11-05T10:00:01Z | 4 |
| 2025-11-05T10:00:02Z | 5 |
| 2025-11-05T10:00:03Z | 5 |
| 2025-11-05T10:00:04Z | 5 |
| 2025-11-05T10:00:05Z | 6 |
| 2025-11-05T10:00:06Z | -3 |
| 2025-11-05T10:00:07Z | -3 |
| 2025-11-05T10:00:08Z | -4 |
Note that the output demonstrates LogScale's rounding behavior
where positive numbers are rounded up when the decimal is .5 or greater,
and negative numbers follow the "round half away from zero" rule (unless
you use how=floor).
Note
To format a number, or round to a specific decimal accuracy, use
format(). See
Rounding to n Decimal Places.
Rounding Within a Timechart
Round down a number in a field and display information in a
timechart using the round() and
timeChart() functions
Query
timeChart(function={max(value) | round(_max, how=floor)})timechart(function=max(value))Introduction
In this example, the round() function is used
with a floor parameter
to round down a field value to an integer (whole number) and
display information within a timechart.
Step-by-Step
Starting with the source repository events.
- logscale
timeChart(function={max(value) | round(_max, how=floor)})timechart(function=max(value))Creates a time chart using
max()as the aggregate function for a field named value to find the highest value in each time bucket, and returns the result in a field named _max.Rounds the implied field _max from the aggregate
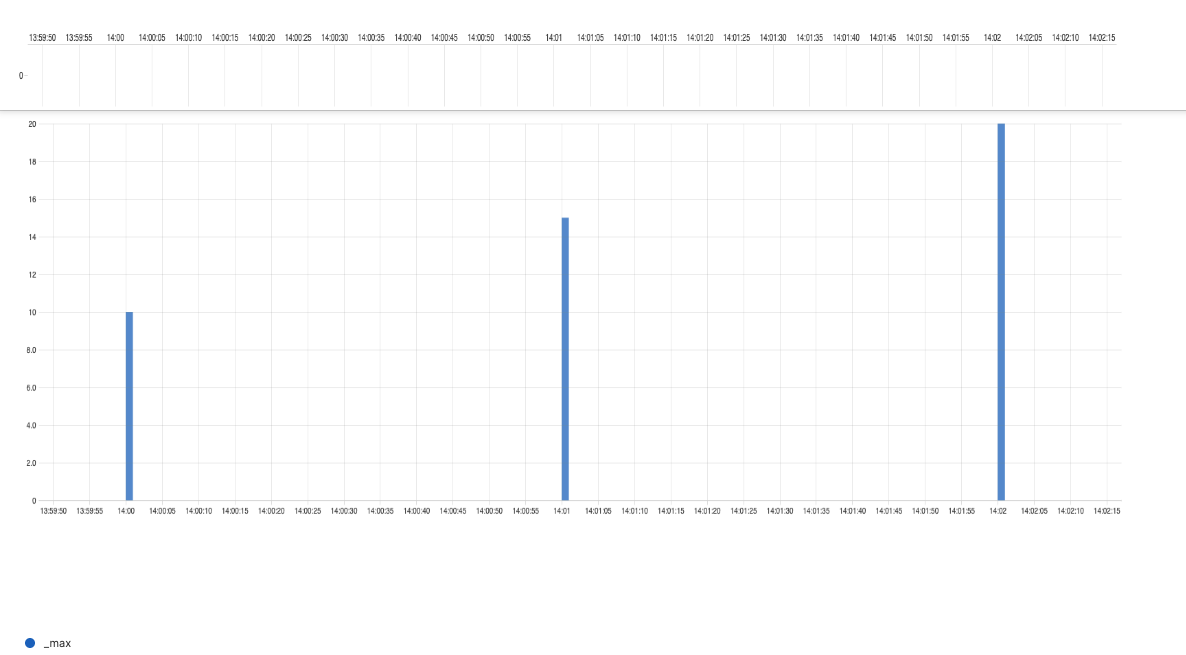
max()using theflooroption to round down the value.Example of original _max values:
10.8,15.3,20.7.After floor:
10,15,20. Event Result set.
Summary and Results
The query is used to round down maximum values over time to nearest integer (whole value). This is useful when displaying information in a time chart. Rounding to nearest integer will make it easier to distinguish the differences between values when used on a graph for time-based visualization. The query simplifies the data presentation.
Note
To round to a specific decimal accuracy, the
format() function must be used.
 |
Rounding to n Decimal Places
Format numbers with precise decimal places using the
format() function
Query
format("%.2f", field=value)Introduction
To round a number to a specific number of decimal points, use
format() rather than round().
By specifying a format string such as %.2f, it is
possible to control the exact number of decimal places displayed in the
output, with standard rounding rules applied automatically.
Example incoming data might look like this:
| @timestamp | value |
|---|---|
| 1742032800000 | 3.14159265 |
| 1742032860000 | 2.71828182 |
| 1742032920000 | 1.61803398 |
| 1742032980000 | 9.99999999 |
| 1742033040000 | 0.12345678 |
| 1742033100000 | 7.50000001 |
| 1742033160000 | 4.56789012 |
Step-by-Step
Starting with the source repository events.
- logscale
format("%.2f", field=value)Rounds the field value to two decimal places.
Event Result set.
Summary and Results
When using format(), rounding is performed using
standard math rules. The format() rounds a number
to a specific decimal accuracy.
Sample output from the incoming example data:
| value | _format |
|---|---|
| 3.14159265 | 3.14 |
| 2.71828182 | 2.72 |
| 1.61803398 | 1.62 |
| 9.99999999 | 10.00 |
| 0.12345678 | 0.12 |
| 7.50000001 | 7.50 |
| 4.56789012 | 4.57 |
Note
To round a number to the nearest integer, use
round(). See
Basic Rounding.