
Display Query Memory
If you use LogScale to monitor your costs in terms of memory consumption, you can display the average memory allocated for your queries activity.
In the
Searchpage, type this query in theQuery Editor:logscale"direct memory allocated" | group=query | avg(bytes)This search extracts the events having
queryas the value found for the group field, and uses theavg()function to calculate the average memory allocation of queries in the system, in bytes.Save your widget as explained at Create Widgets
Click the menu icon on top-right of the widget and select , the Styling panel is displayed on the side of the widget:
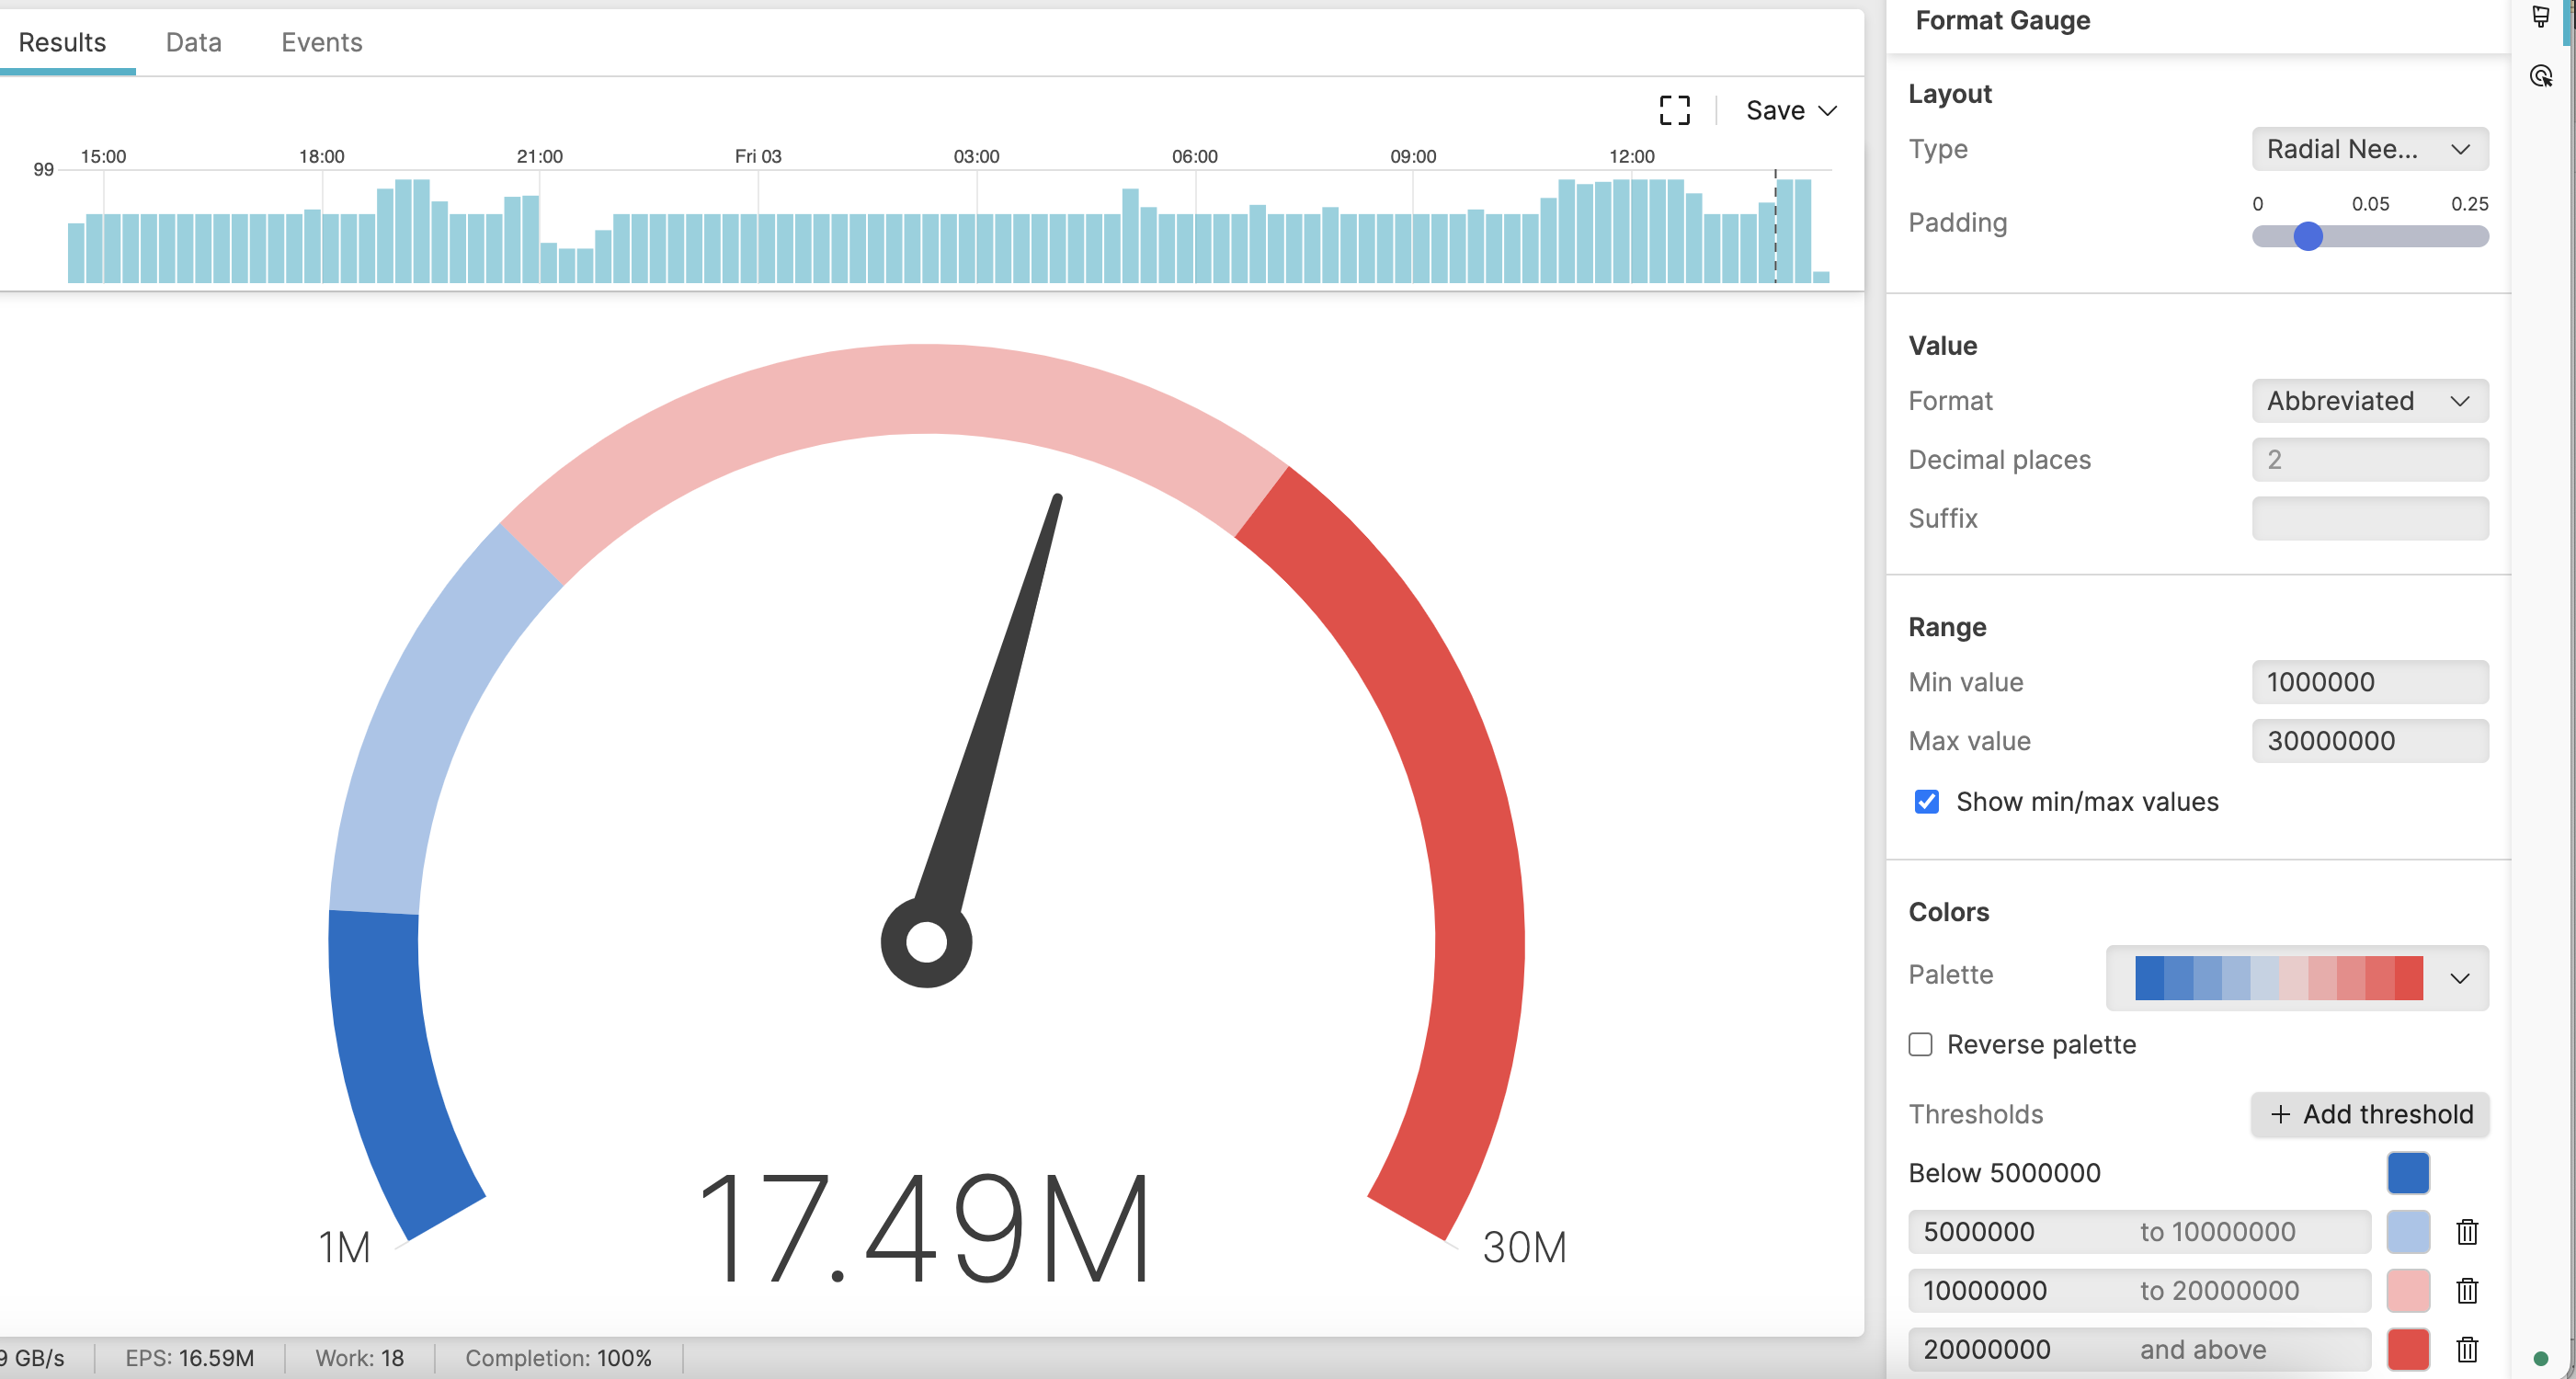
Figure 221. Gauge chart with properties panel - Example 2
Set the properties as desired:
Layout → choose type in this example
Value → choose the format to show the values as millions (M)
Range → define the min and max values your widget should display
Colors → choose a palette among those available
Thresholds → set consistent thresholds according to your data: for example, you want values exceeding 20 millions bytes of memory displayed in red.