Field Interactions
LogScale web interface offers contextual menus for various interactions with fields. What interactions are supported depends on the Field Data Types of the selected field.
To access these menus:
Locate the icon next to a field in any of these areas:
Event List panel
Fields panel
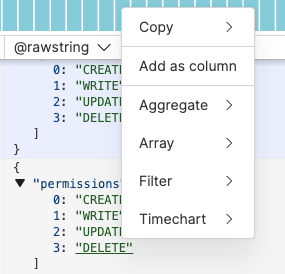
Click the icon to open the contextual menu. In this example screenshot, the field interaction menu is opened from the Results tab:
 |
Figure 96. Field Interactions
Available interactions are:
— copies the value or the field's name, which you can paste in the
Query
          editor
. It works in any field interaction within the Fields panel andInspection panel. It also works in the Source Events panel when the data type is JSON or Log line.You can copy the field in different formats:
copies the field's name. Click inside a nested field in a JSON structure and copy the field name — the whole path will be copied into the field and this corresponds to the field inside LogScale.
copies the field's value.
escapes the string in LogScale format, ready to paste it directly into any query. This can be useful in case of special characters that need escaping; the same applies for the field name — if they include special characters, they are also going to be escaped.
copies the field's value as a regular expression.
— adds the selected field as a column. The size of the column fits the name of the field or the content of that field, whichever is largest.
Additional interactions are available on both value fields and name fields. These are:
— enables two aggregate options:
— allows filtering based on array values on any position of the array, using the
array:contains()query function to query data. It only shows for JSON array fields. Two options are available:filters events by requiring a string value to be present in the array. For example, given a list of users with different access permissions in the Event List, it is possible to filter for any user who has WRITE permissions, independent on where the WRITE value is in the array. The following query is applied when this interaction is selected:
logscalearray:contains("user.permissions[]", value=WRITE)allows for inverted filters, meaning it filters events by requiring a string value that is not present in the array. For example, given a list of users with different access permissions in the Event List, it is possible to filter any user who does not have WRITE permissions. The following query applies when using this interaction:
logscalenot array:contains("user.permissions[]", value=WRITE)Note
Because
array:contains()checks for a single value at the time, you must run multiple Array interactions, if you wish to filter on multiple values in the array.
— used to filter out or keep items, can be done on the value or on the field name. Filter interaction options include:
allows including events that match the selected value.
guides you to how to apply a regex to a field using the literal syntax.
allows excluding events that have the selected value.
allows including events with the selected field.
allows excluding events without the selected field.
— available on fields that contain IP addresses, such as actor.ip . This option allows for filtering IP values by appending specific query functions. IP interaction options include:
generates a new query using the
ipLocation()function. The new query uses the name of the selected IP field as thefieldargument.generates a new query using the
worldMap()query function. The new query uses the name of the selected IP field as theipargument.generates a new query using the
ioc:lookup()query function. The new query uses the name of the selected IP field as thefieldargument. Click and IP field, say ip_address, to generate a new query in the Query Editor, like this:logscaleioc:lookup(field=[actor.ip], type="ip_address", confidenceThreshold="unverified", strict=true)
— available on fields where a number is detected. The options , , and apply these aggregates to the field.
Note
Numbers that exceed the range of safe integers in Javascript are replaced in JSON by reading the associated LogScale value directly. This is to avoid that incorrect numbers are displayed. These replaced numbers are highlighted in JSON data to indicate that they might be wrong. For more information, see Troubleshooting: UI Warning: The actual value is different from what is displayed.
— available on fields that have JSON, URL and Timestamps content, it parses the field as a LogScale field. This is possible because LogScale is able to detect the type of each field. This detection enables specific interaction options for different field types. For example:
When LogScale detects a JSON string in a field, it displays the → option in the menu.
When LogScale detects a URL in a field, it displays the → option in the menu. This option splits the URL into its component parts.
— field interaction options include:
generates a
Time Chartwith individual series for each value in the selected field.gives the number of occurrences for the field.
and are available on number fields only — for example, when LogScale detects a number, it will generate a
timeChart()percentile query.
When you hover over one of the available options under
, you will get a tooltip
describing the query update. In the following example, the option selected
appends timeChart() to the query, for the
#repo field.
 |
Figure 97. Query Update Tooltip
Tip
Use SHIFT+click to add the suggested option to the query string without running a new search.