
Display Small Multiple Charts
You can compare results for the different values of a field: for
example, how many ERRORS,
INFO and
WARN values for the field
loglevel are returned, and
display them next to each other in a grid.
From the
Searchpage, type this query in the Query Editor:logscalegroupBy(loglevel)This search groups values of field loglevel.
Save your widget as explained at Create Widgets
Click the menu icon on top-right of the widget and select , the Styling panel is displayed on the side of the widget:
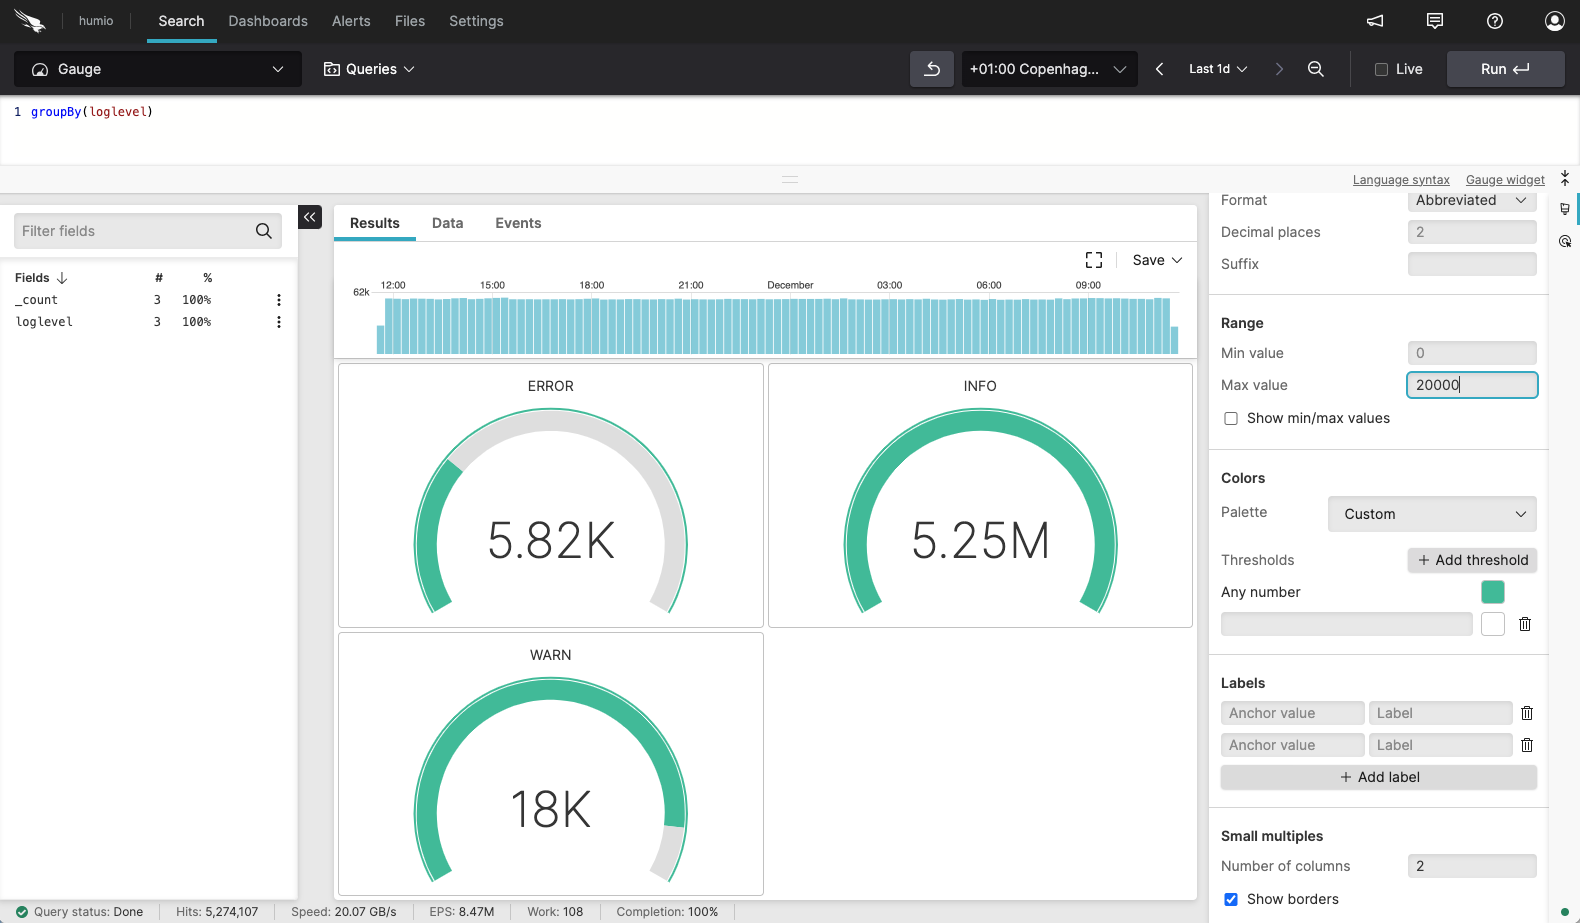
Figure 222. Gauge Chart with Properties Panel - Example 3
Set the properties as desired:
Layout → choose type in this example
Value → choose the format
Range → define the min and max values your widget should display
Colors → any number should have the same color
Small multiples → the grid should display small multiples in 2 columns