
Create Widgets
Security Requirements and Controls
Create dashboardspermissionData read accesspermission
You create a widget when you want to save a search query and visualize its results in a dashboard for ongoing monitoring.
To create a new widget from a search, follow these steps.
Go to the tab in the main LogScale User Interface and pick a repository.
Enter a query of your choice, one that would best suit your data.
Click the Time Selector on top to choose the time interval (for example, ). The active search interval used is saved along with the widget. For details on the timeframe you can set, see Change Time Interval.
Choose the preferred or compatible chart using the Widget selector dropdown: one chart type is selected by default depending on the query you have entered — in the example figure, see Widgets Gallery for all the available widgets.
Click — you should now see the graph or table in the main panel; if not, check again the time interval you have selected, as it should be consistent with your data set.
Click the menu at the top right of the graph pane and select the option.
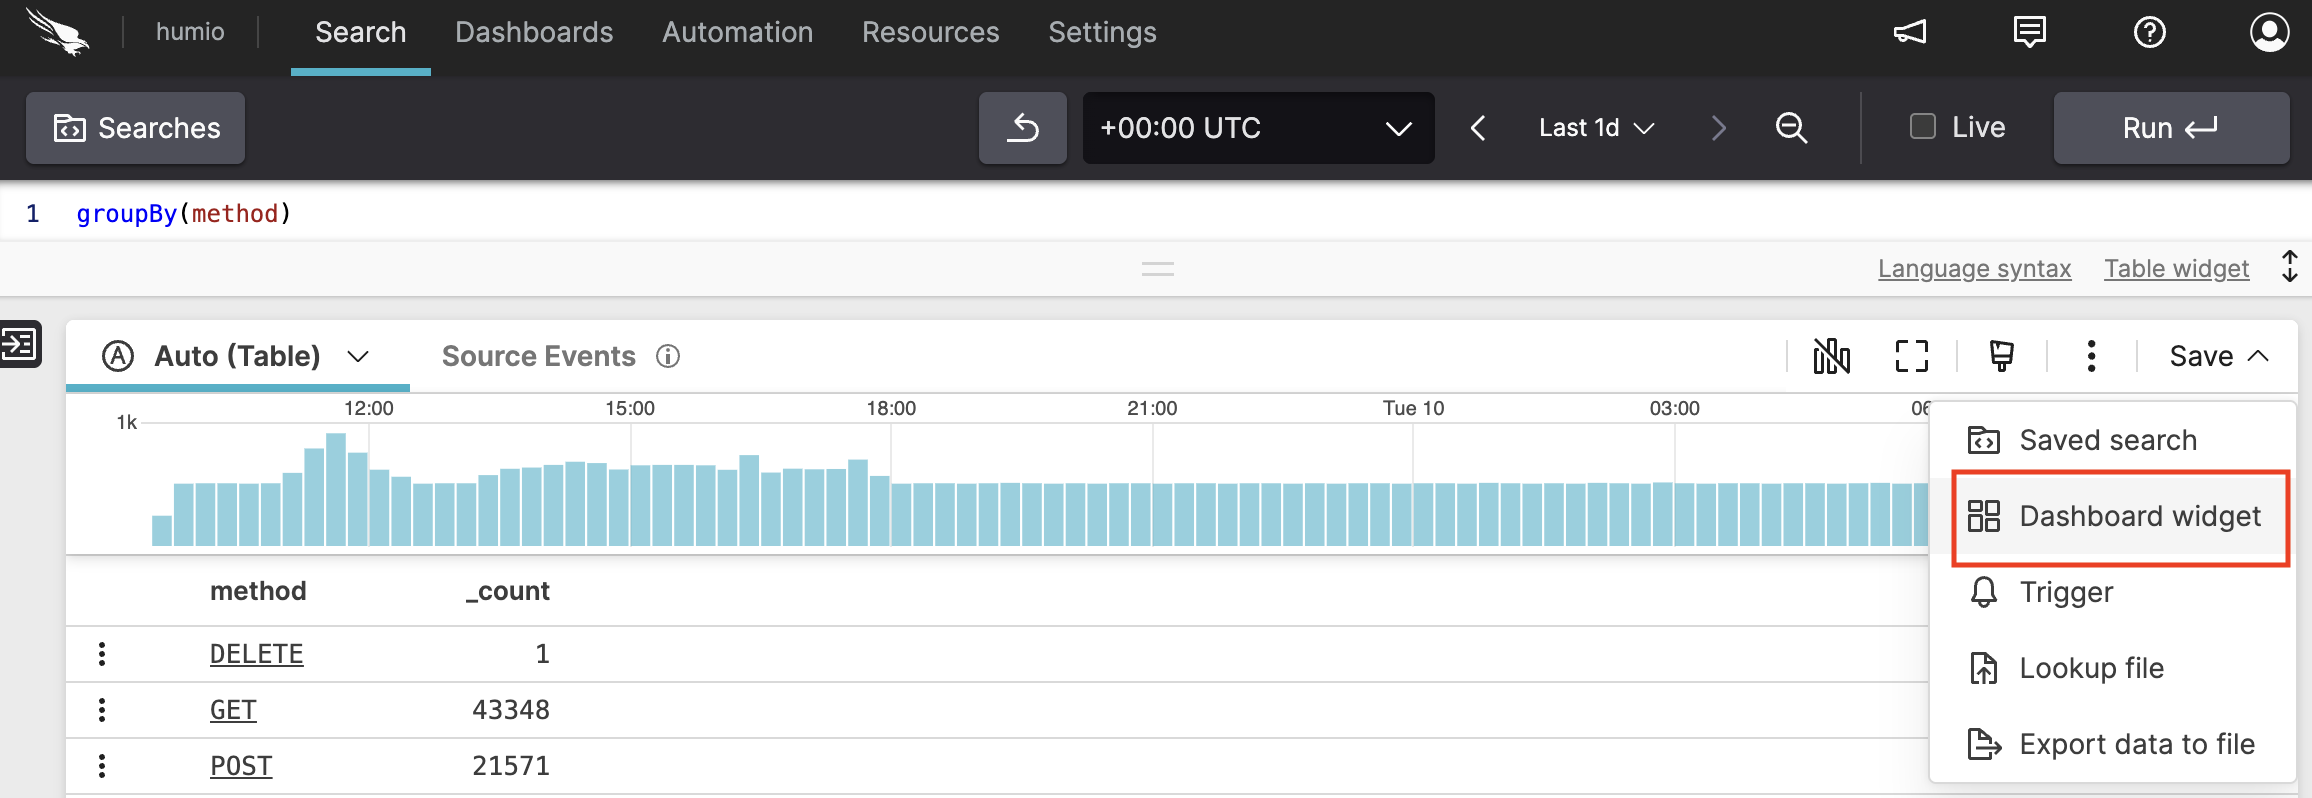
Figure 200. Creating Dashboard Widget
In the Dashboard widget dialog popping up, enter information as required:
Dashboard — Select from the menu. You have the option of assigning the widget you're creating to an existing dashboard, if there is any.
Dashboard name— enter a name for the new dashboard this widget will belong to.
Dashboard color palette— automatically applies the default dashboard color palette. Select a different palette if instead you want to differentiate the color of this widget.
Widget title — provide a title to the new widget.
Widget description — provide a description for the new widget.
checkbox — click it to have your new widget opened in the dashboard.
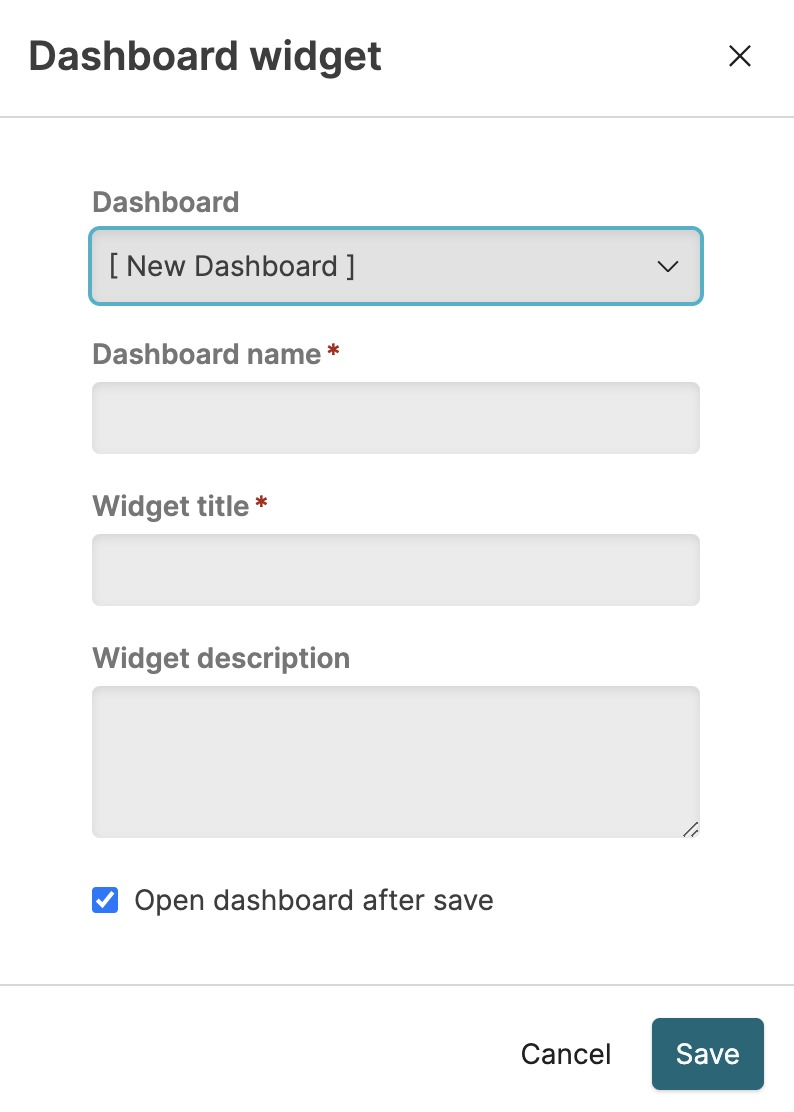
Figure 201. Dashboard Widget dialog
Click : your new dashboard is created and appears in the main pane.
Optionally, click the edit icon on the top right to resize or rename your widget, change the description, etc.