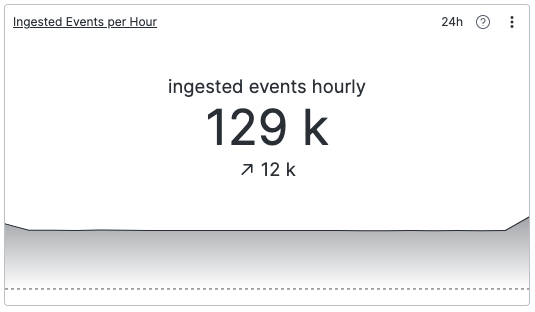
Displaying a Trend with a Timechart
The Single Value widget can be
efficiently used in conjunction with the
timeChart() function.
timeChart(span=1h)This query produces a result containing the number of ingested events per hour. The result contains two fields: _bucket and _count. The _bucket field annotates each bucket with a timestamp, whereas the _count field is the value (number of events ingested).
 |
Figure 221. Single Value Widget with timeChart()
When used with a timeChart() function in the
search, specific styling options become available for the widget,
allowing it to show the following:
A value — The main central number indicates the value, in this case _count, in the last bucket, depending on whether the Last Bucket property has been set to include it or not, see Single Value Property Reference.
A trend — The difference in the value field, in this case _count, over the selected period. This is calculated by subtracting the value of the first bucket from the value of the last bucket.
A sparkline — Illustrates the value over time if the Sparkline property is toggled (see Single Value Property Reference). Along with the trend, this is useful to give some context to the value that you're looking at. For example, it can indicate whether the value you're looking at is volatile, or if it's relatively stable.