
Displaying Values in a Grid
The Single Value widget used in
conjunction with timeChart() or
groupBy() functions can visualize results in a
grid of multiple charts.
With timeChart() used with a series field like
method:
logscale
timeChart(method)Values and trends for each individual result are displayed next to each other:
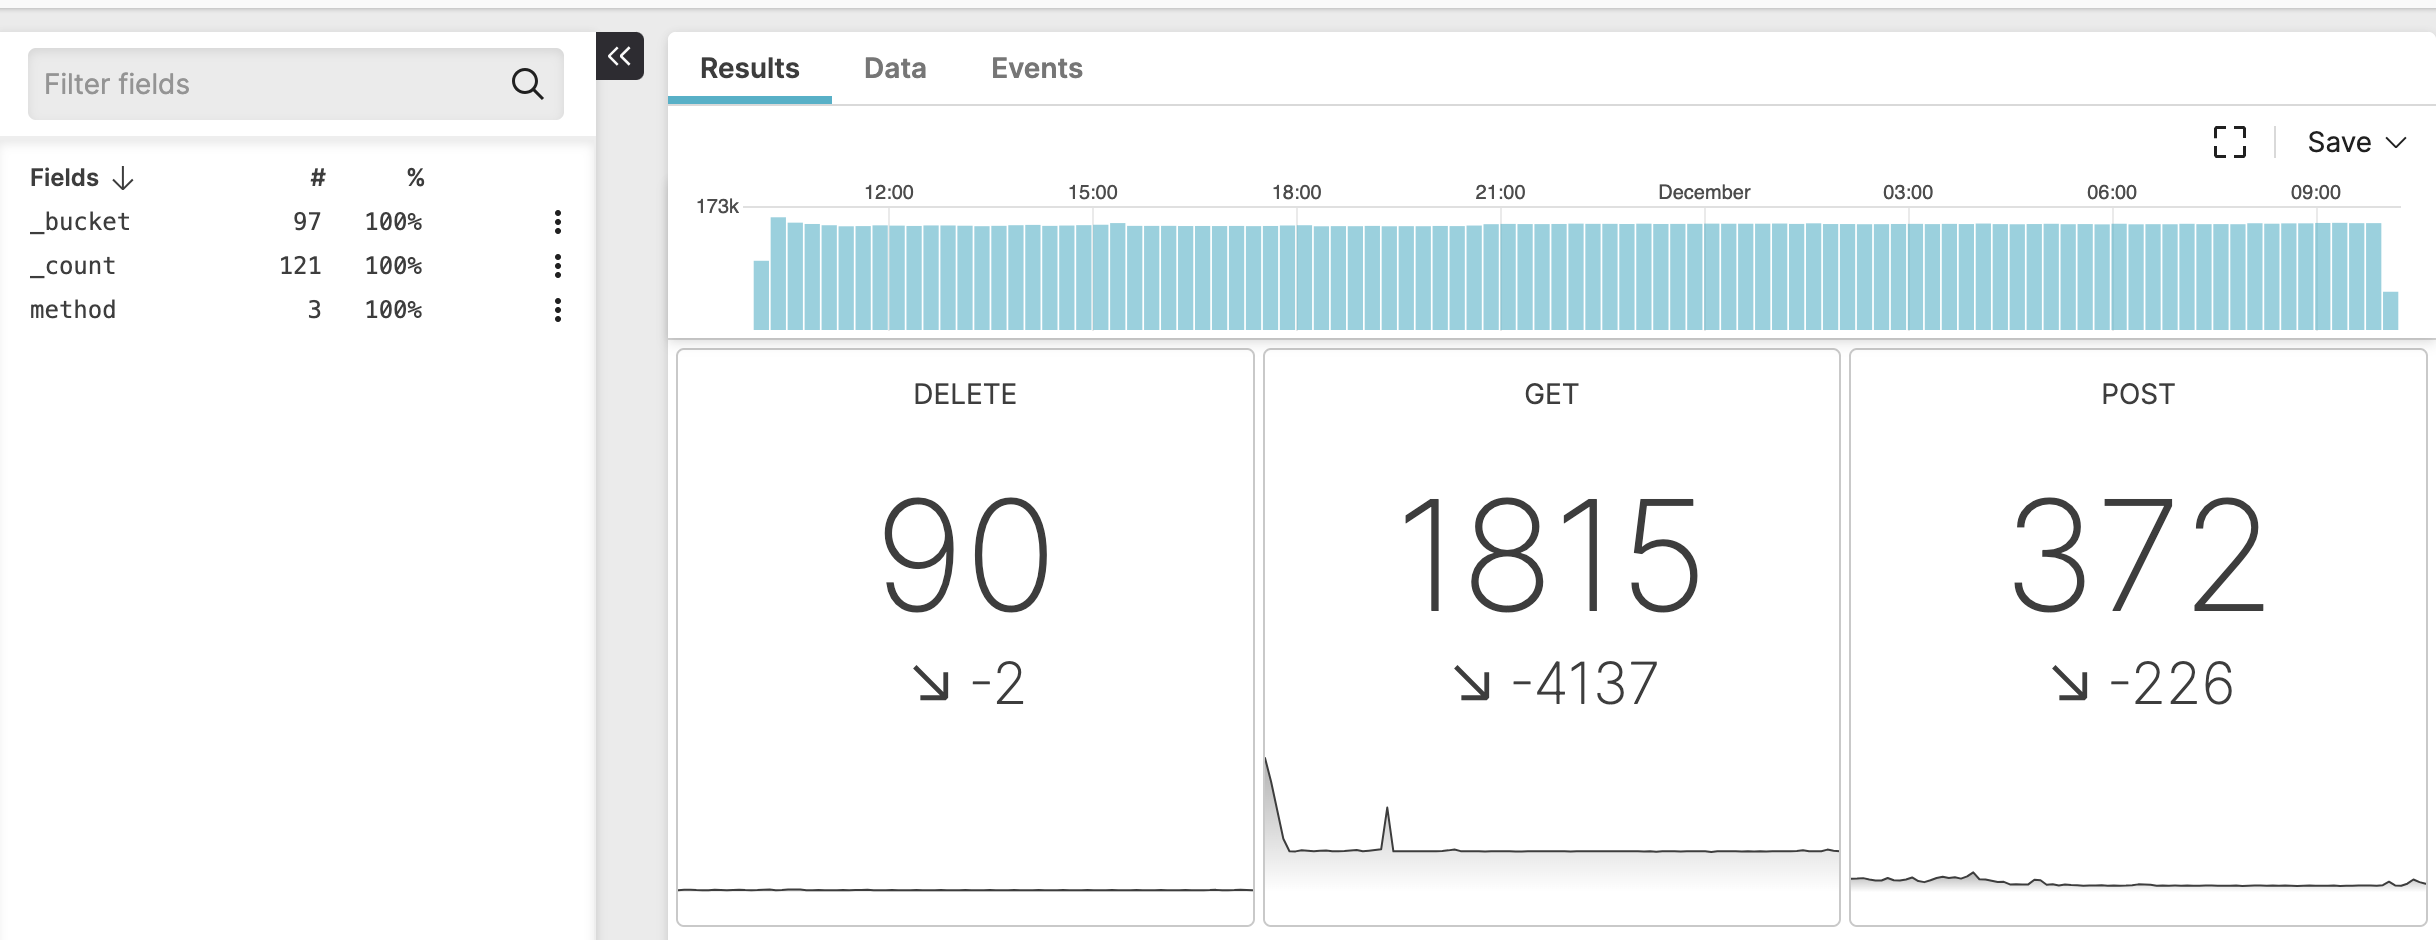 |
Figure 243. Single Value Widget with Small Multiples
A similar visualization can be achieved with
groupBy() on a single field together with
count().