Gauge
The Gauge Widget is a visualization tool for displaying single numeric values within defined ranges to effectively monitor metrics like error rates, progress indicators, and system resource utilization. The widget supports customizable properties including value formatting, color thresholds, range settings, and small multiple charts for comparing grouped data, making it ideal for creating clear visual indicators of system performance and status.
The Gauge
widget serves as a visual
representation of a single numeric value within a defined range.
Figure 203, “Gauge Chart” shows how this widget looks like.
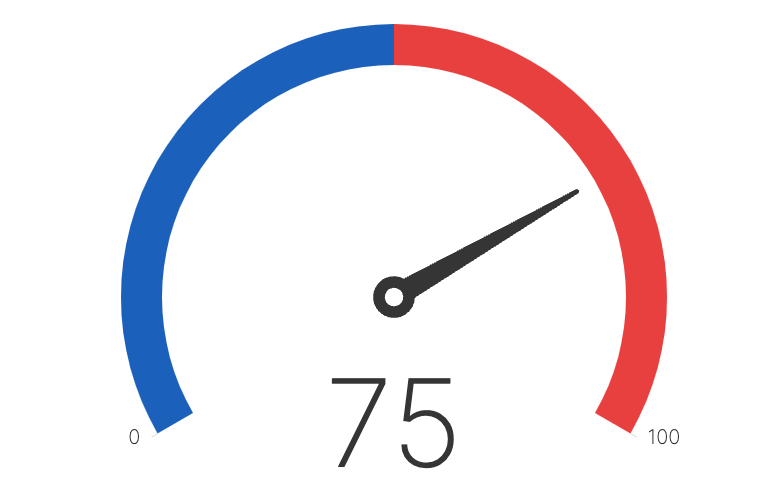
![]() |
Figure 203. Gauge Chart
Review these sections for Gauge
widget
details: