

Optimize Dashboard Performance with Persisted Aggregations
Dashboards that use queries based on persisted aggregations refresh faster and respond more quickly because they query pre-computed results instead of reprocessing raw log data. The dashboard appearance and behavior remain unchanged.
When you create dashboards with widgets that run computationally intensive aggregation queries, you can improve performance by using Persisted Aggregations. A persisted aggregation runs an aggregation query on a schedule and stores pre-computed results in a dedicated repository. When dashboard widgets query this data, LogScale retrieves the stored results instead of recomputing the aggregation from raw logs.
Performance Benefits
Using persisted aggregations in dashboards provides these performance advantages:
Faster dashboard refresh times because queries access pre-computed results
Lower resource costs for compute-intensive aggregations
The dashboard layout, widget types, and user interactions remain exactly the same whether using persisted aggregations or querying raw data directly.
Example: Using Persisted Aggregations in Dashboards
Dashboard widgets can display pre-computed results from persisted aggregations using the readPersistedAggregation() function. This allows dashboards to refresh quickly by retrieving stored aggregation results instead of reprocessing raw log data.
Figure 160, “Dashboard Using Persisted Aggregation Results” shows a dashboard widget displaying API metrics retrieved from a persisted aggregation:
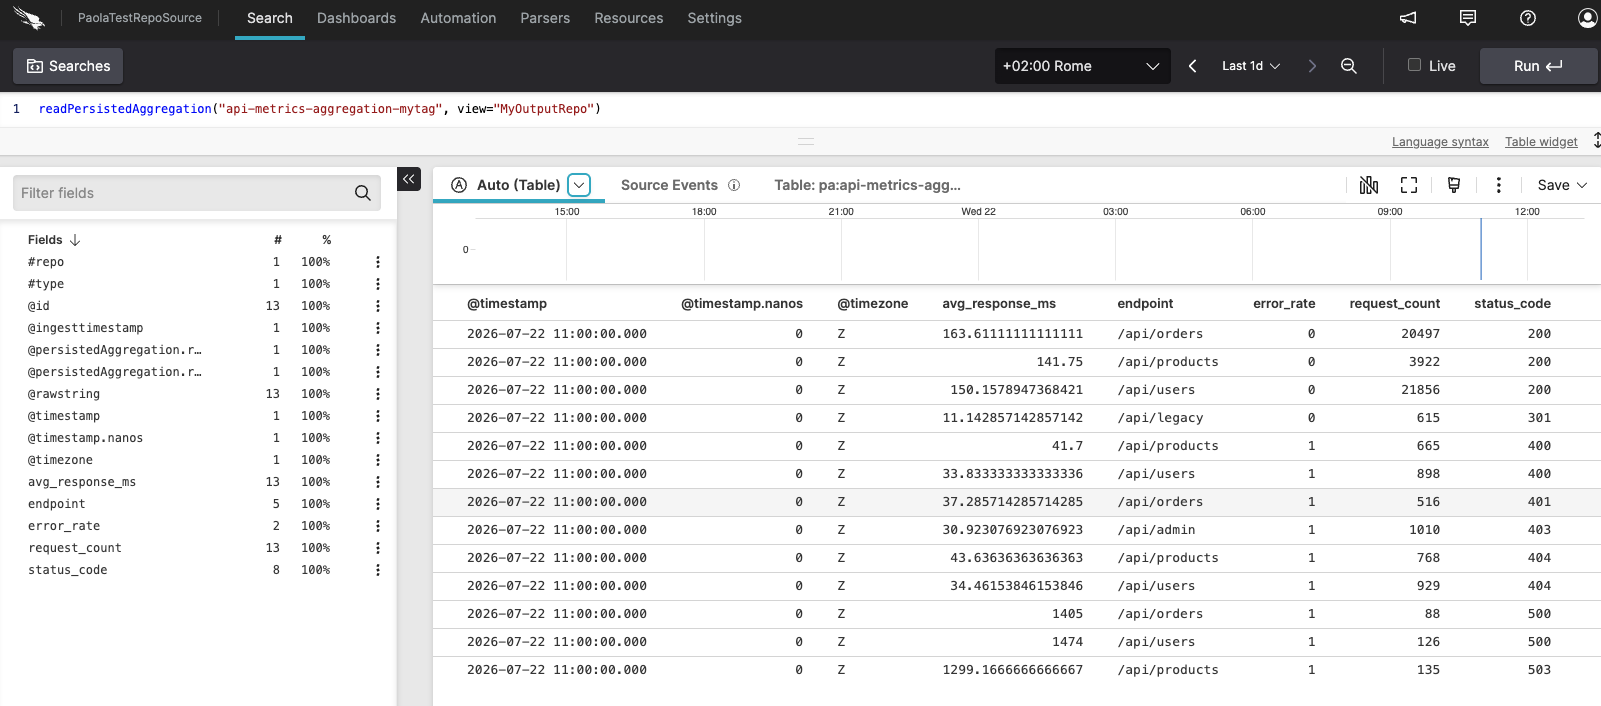 |
Figure 160. Dashboard Using Persisted Aggregation Results
The dashboard widget uses the following query to retrieve the pre-computed aggregation results:
readPersistedAggregation("api-metrics-aggregation-tag", view="MyOutputRepo")
The query retrieves aggregated API metrics (request counts, average response times, and error rates grouped by status code and endpoint) that were pre-computed by a persisted aggregation. The view parameter specifies the repository containing the persisted aggregation output. For a detailed walkthrough of this query and example, see readPersistedAggregation() Examples.
When to Use Persisted Aggregations
Consider using persisted aggregations for dashboards that:
Are accessed frequently by multiple users
Run complex aggregations over large datasets
Display metrics that do not require real-time precision
Need consistent response times regardless of data volume
For information about creating and managing persisted aggregations, see Persisted Aggregations. For query syntax requirements, see Query Language Requirements.