
Blocked Queries
When necessary, LogScale can be configured to prevent queries from executing. There are many scenarios in which one might consider blocking a query or a pattern that matches many queries. For instance, a query pattern may use a large portion of the system's resources. Or a particular query is known to be used for malicious purposes (such as, searching for secure secrets). Or it may be that a log line contains information that should never be searched.
Blocks can be added to the blocklist by defining the following conditions:
Based on a regular expression using the standard LogScale regular expression mechanics.
Based on an exact matching query, explicitly matching the defined string.
Either against a specific Repository or all repositories.
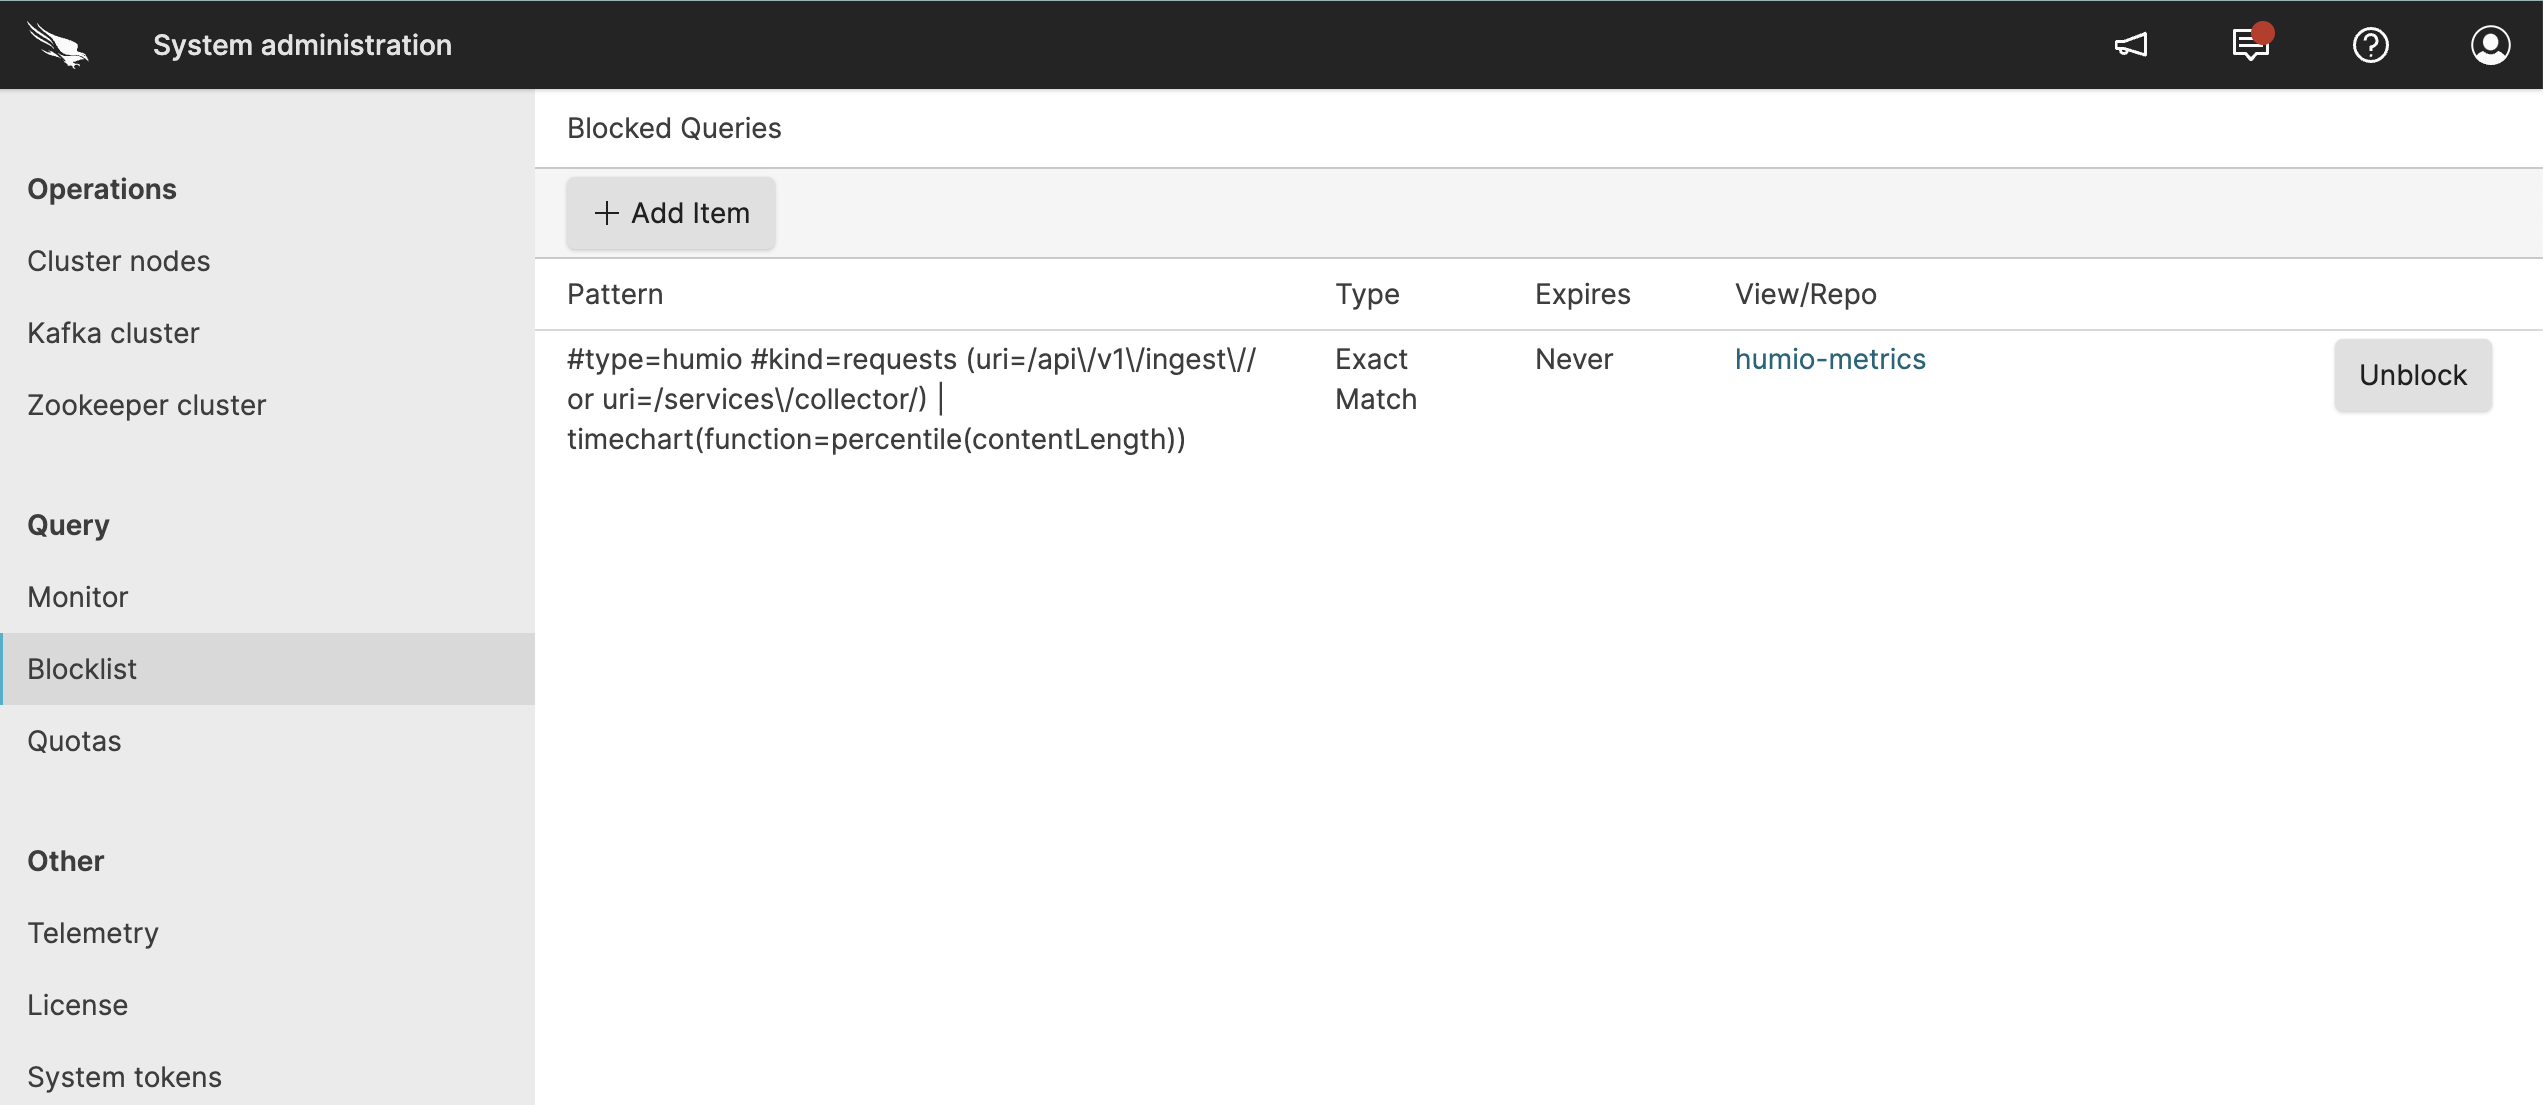 |
Figure 18. Query Administration Blocklist
The lists the currently blocked queries and includes the following information:
Pattern
The string or regular expression of the query that is blocked.
Type
Whether the block is based on an
Exact MatchorRegular Expression.Expires
When the block expires.
Repository or view
The view(s) or repositories to which the block applies.
To use the GraphQL API to get a list of blocked queries, see the blockedQueries() documentation page.
Indications that a query is blocked
Important
A blocked query may indicate that a LogScale SaaS instance is being upgraded. For more information, see LogScale SaaS Upgrades.
LogScale users can identify when their queries have been blocked through clear warning messages in the Search interface and detailed error notifications that specify the matching blocklist pattern. When queries are blocked, users receive explicit feedback about the restriction, including the specific blocklist entry for reference when discussing with administrators, while also being aware that query blocks may occur during upgrades.
Within the Search interface, a warning
message is shown, as shown in
Figure 19, “Query Administration Blocked Query”.
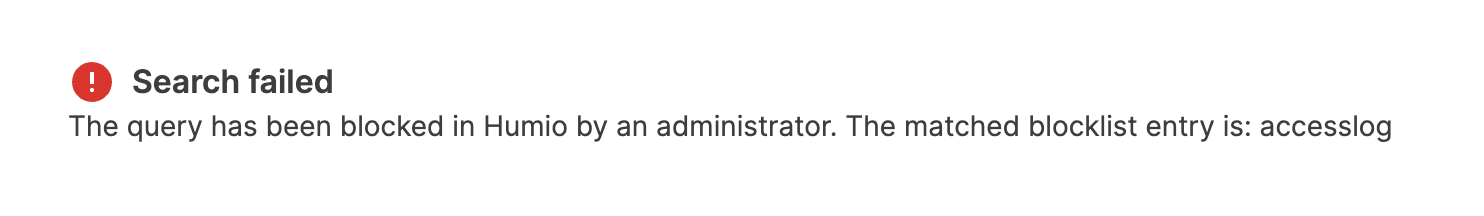 |
Figure 19. Query Administration Blocked Query
Say for instance that you added the pattern
/admin-[0-9]?/ to the global blocklist and then you
submit a query for admin-1.
LogScale presents a very detailed message in place of event data:
Failed to execute the query
There was an error while trying to start the query:
The query has been blocked in LogScale by an administrator.
The matched blocklist entry is: /admin-[0-9]/
This helps you know what has happened and how future queries may be impacted. If you are concerned with this blocklist entry, you may pass along the pattern to an administrator, making it easy to locate in the blocklist.