
Query Monitor
The enables live viewing of queries being executed within the cluster, showing resource usage and displaying detailed information about the process.
Note
The Monitor queries
permission is required to access the query monitor. Organization owners
can access the page and grant access to other users by granting them this
permission.
To access the page, select from the menu. Then select under .
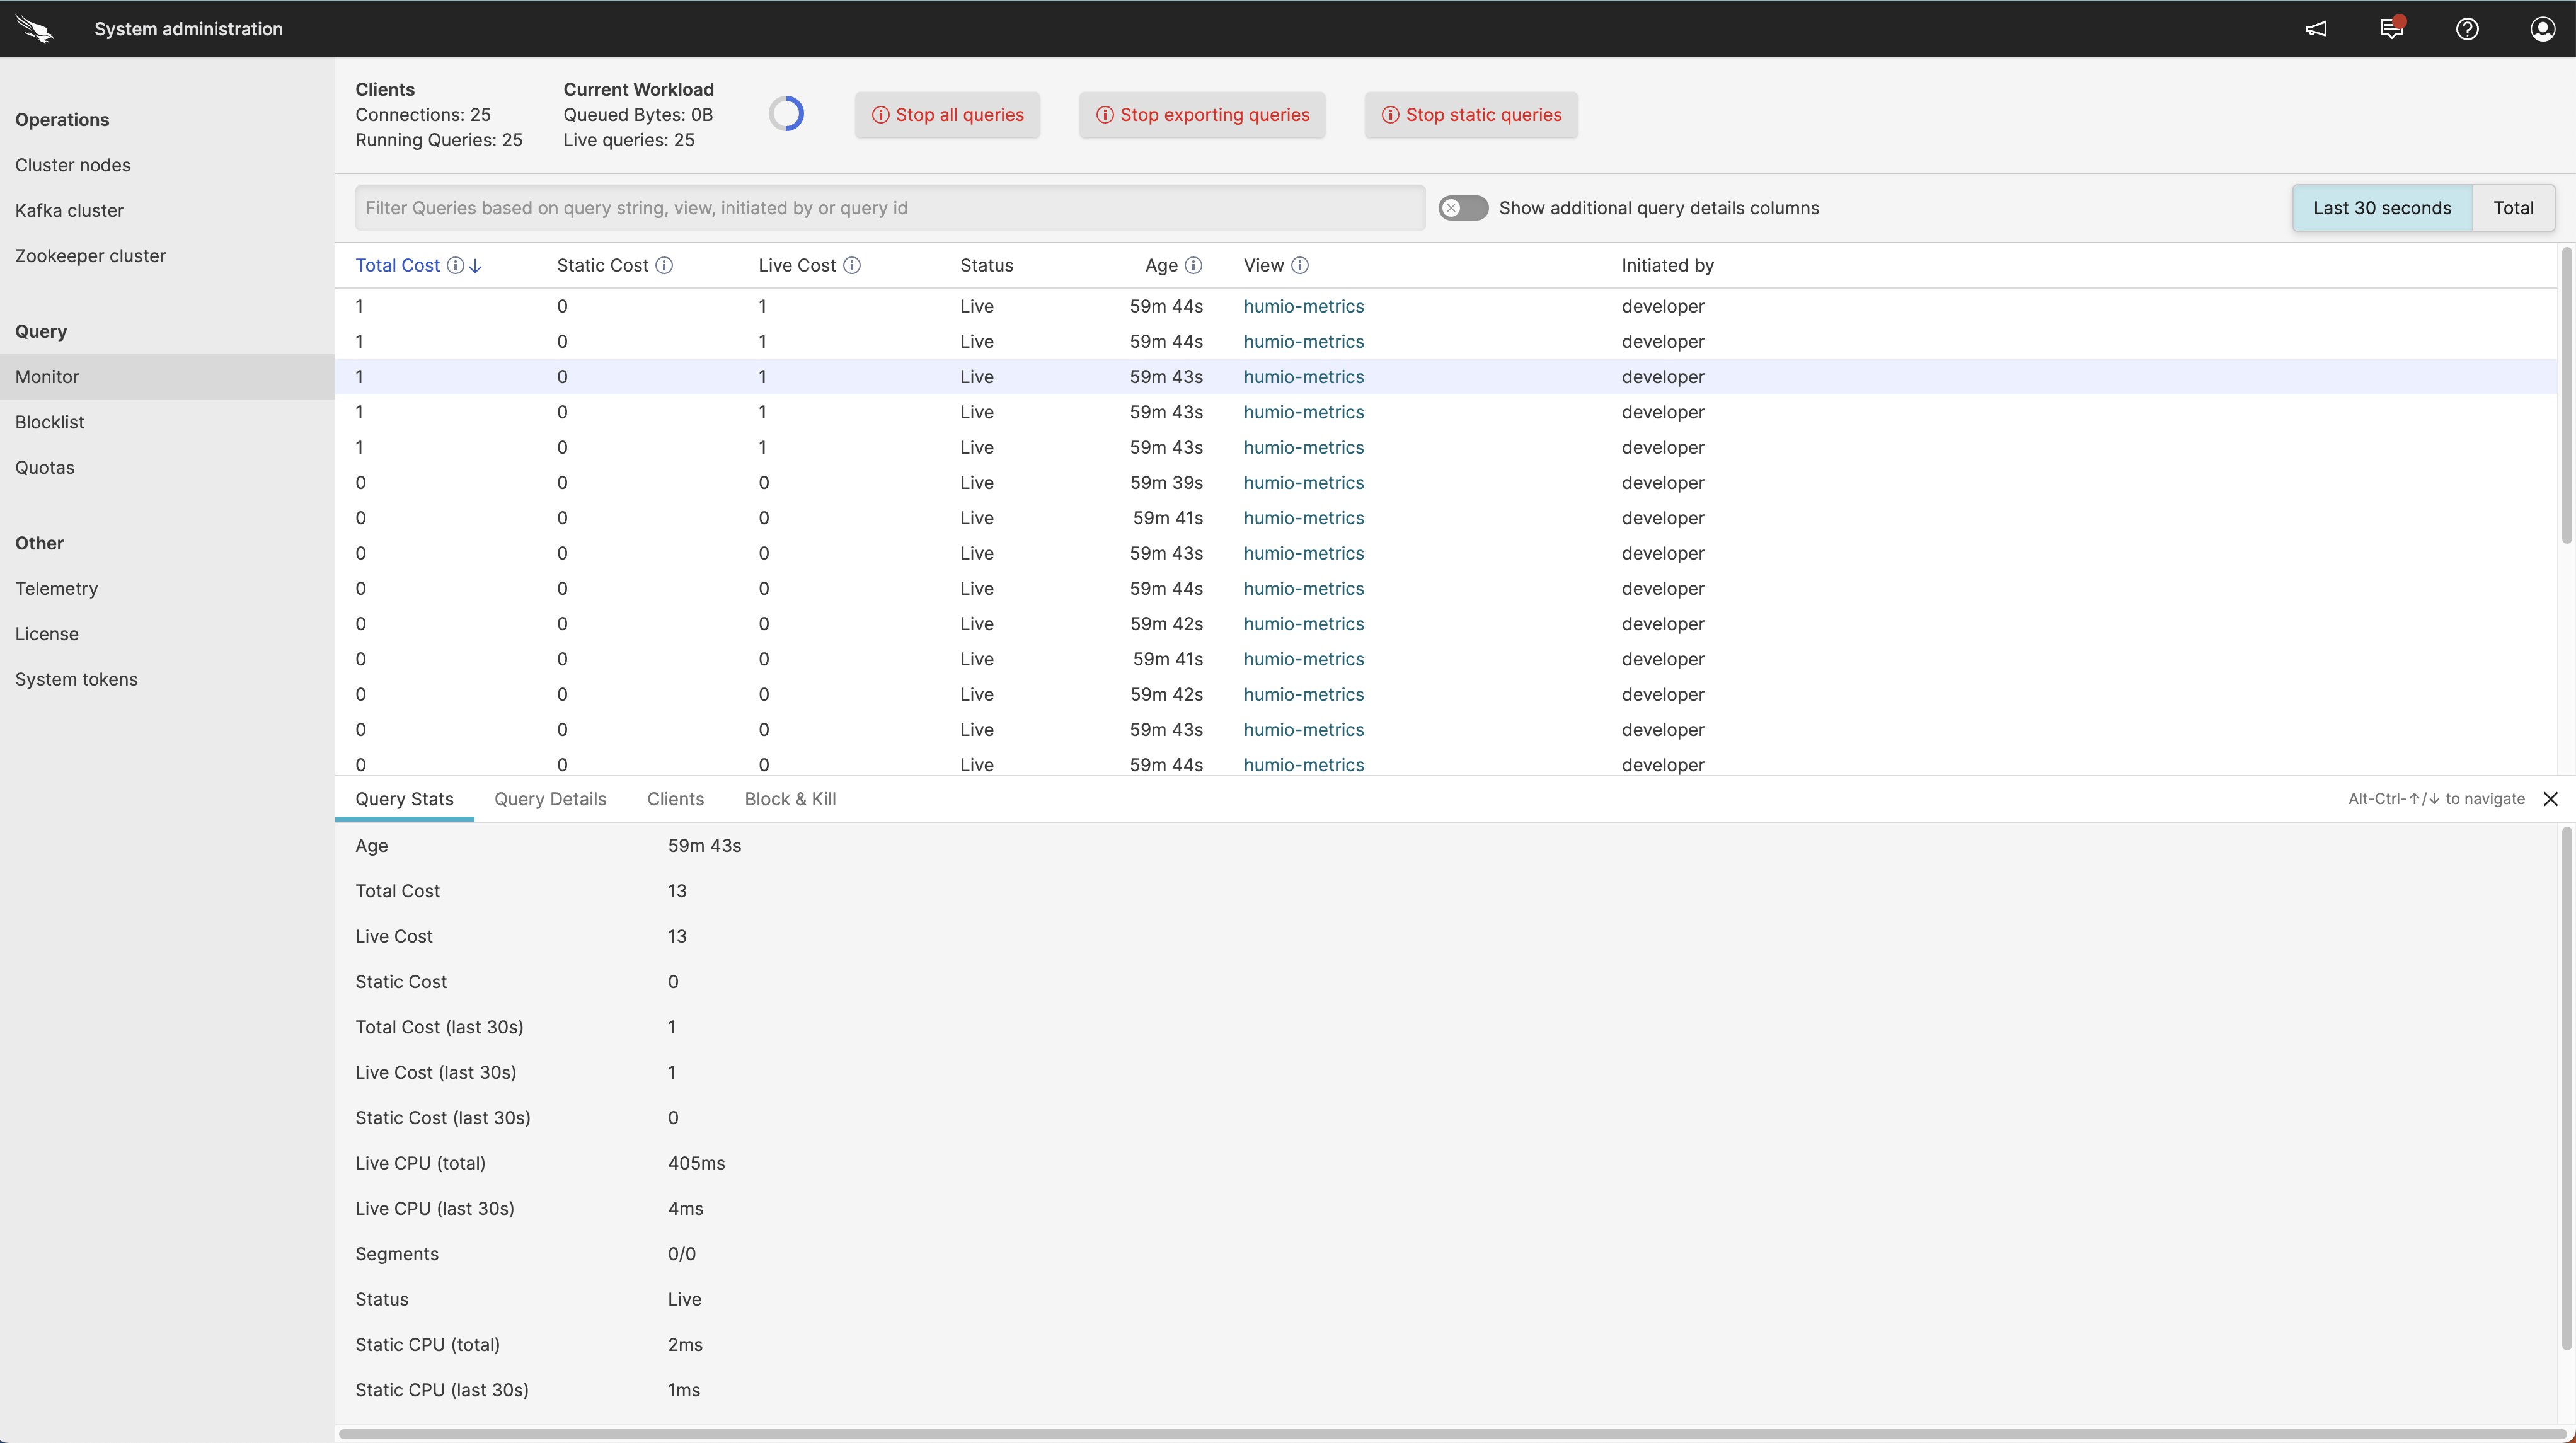 |
Figure 11. Query Monitor
The contains information about the queries running in the current organization. The main part of the query monitor is the tabular view that shows the top 1000 queries running.
Important
Streaming Aggregate Queries will not be shown in the list of running queries, and they are not canceled by the button. These queries can only be canceled by rebooting LogScale nodes.
Each query that runs in the LogScale cluster uses CPU and I/O resources to varying levels. This is often referred to as the Query work. The cost of a query can be used to compare two queries against each other, but not to rate or identify the work for a single query. Using the , administrators can determine which query has the largest impact right now, or through the query's runtime. If a query is using too many resources it can be temporarily killed or completely blocked, prohibiting it from being run again.
The main display is divided into three sections.
Summary data at the top
List of queries in the middle
Detailed panel of information for a selected running query
The display of running queries is refreshed automatically every ten seconds; the redrawing blue circle at the top of the display shows the refresh information. The query data displayed can be controlled using the various Query Monitor Display Controls, including filtering the content and switching between showing recent (last 30 seconds) and all queries.
Query Monitor Display Controls
The information displayed in the main panel can be controlled using the buttons in the main display.
| Button | Description |
|---|---|
| Last 30 Seconds/Total | These two buttons switch the display between showing only queries executed within the last 30 seconds, and the data for all queries executed. |
| This toggle enables three additional fields showing resource CPU and memory usage to be displayed for each of the shown queries. | |
| Filter search | The filter search box allows you to filter the displayed queries by searching for specific information, including the query string, affected view, the user or the query ID. To filter the results, just start typing into the box. |
| Stops all running queries immediately | |
| Stops queries that are exporting data or events | |
| Stops queries that are reading data from archived storage |
In addition to selecting the different queries directly, the Alt+↑ and Alt+↓ allow you to move up and down through individual displayed queries.
Query Monitor Summary Information
The first part of the shows summary information for all the queries being monitored and displayed:
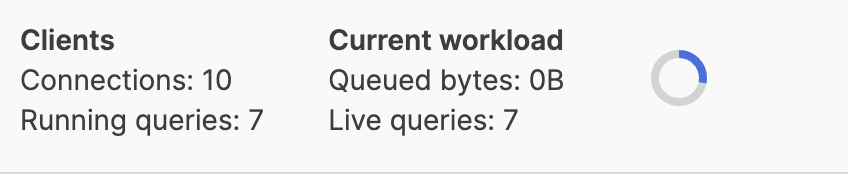 |
Figure 12. Query Monitor Summary Panel
| Area | Item | Description |
|---|---|---|
| Clients | Connections | Shows the number of active query connections to the cluster. |
| Running Queries | Indicates the number of queries currently being executed. This includes all running queries, either through the search interface, dashboards or automations. | |
| Current Workload: shows the active workload on the cluster | Queued Bytes | The estimated number of bytes that LogScale needs to load from disk in order for the currently executing queries to finish processing the history parts of the query. |
| Live Queries | Indicates the number of queries currently being executed that are waiting on data. This number may differ from the total running queries count because some automated queries and dashboard refresh operations may not be actively waiting for data. |
Query Monitor Table List
The main table lists the currently running queries. The list of running queries can be sorted by selecting a specific column to change the displayed order. You can also filter and restrict the view using the filter box at the top of the list.
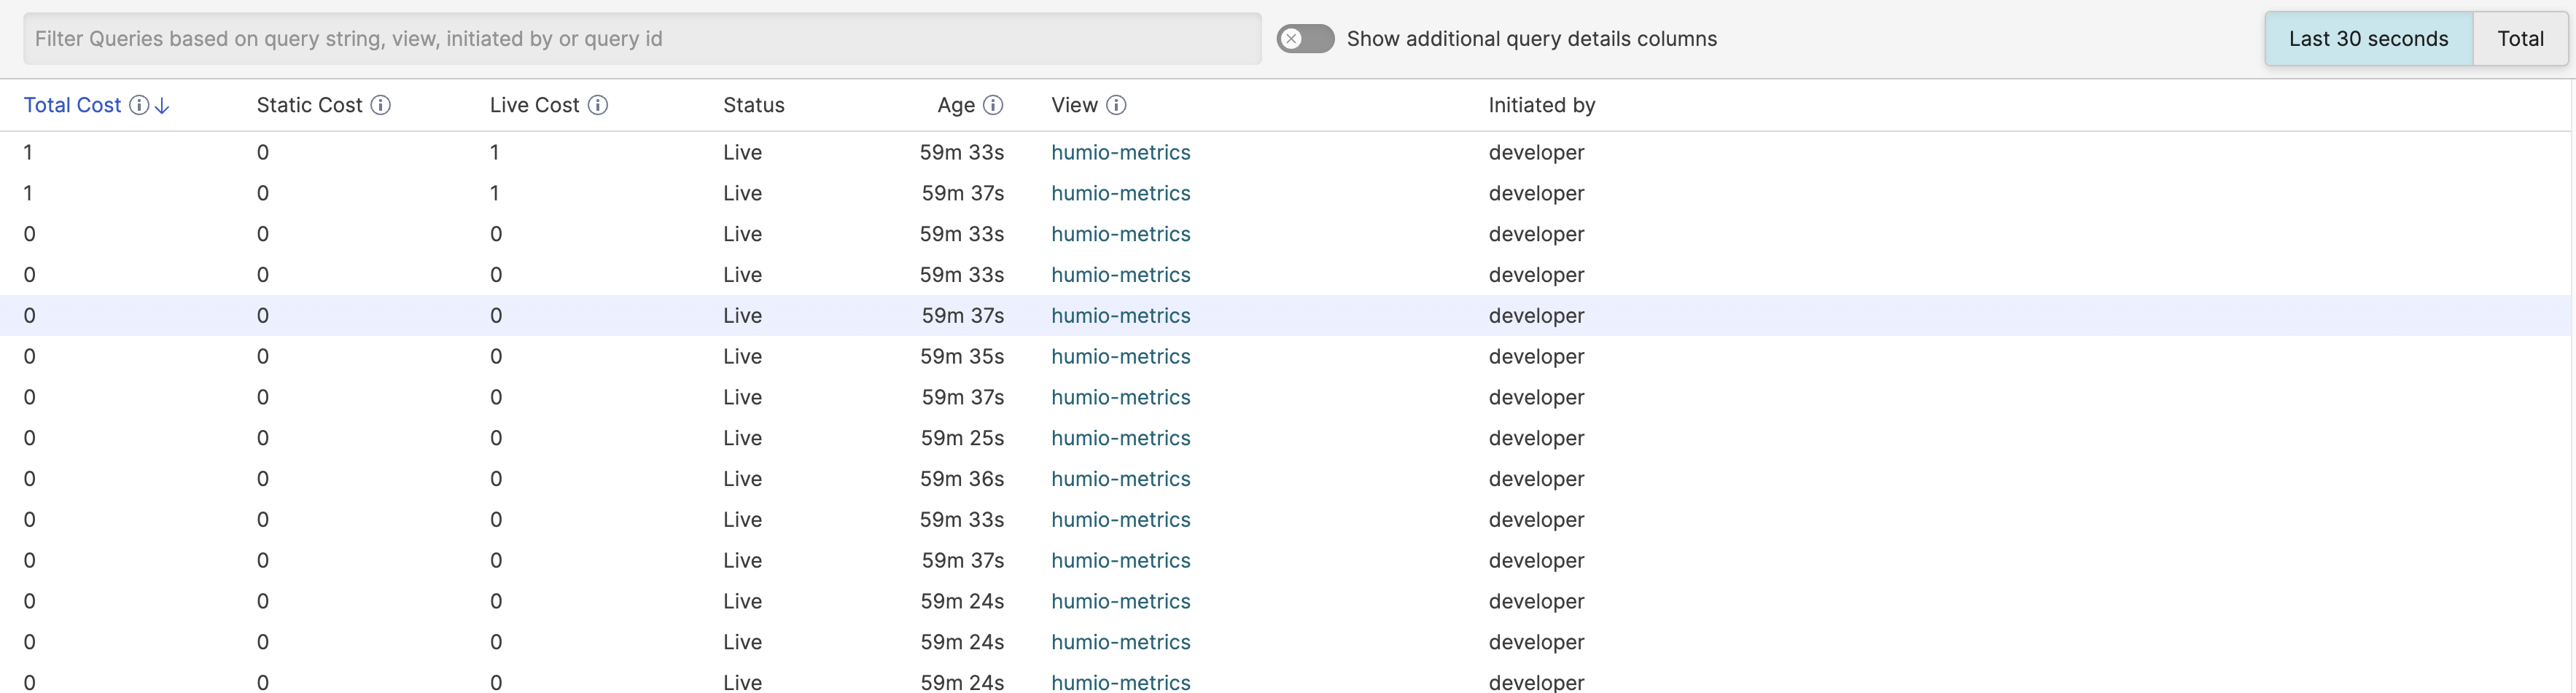 |
Figure 13. Query Monitor Table
| Column | Description |
|---|---|
| Total Cost | Overall cost of executing the query in the last 30 seconds. The query cost is calculated as a combination of the CPU and memory requirements for a given query. The value can be used as a comparison cost value when comparing queries against each other. However, it is best to check the specific CPU and memory requirements. |
| Static Cost | The static cost of executing the query during the last 30 seconds. The static cost is a measure of the effort by the cluster to process historic (archived) data to perform the query. |
| Live Cost | The live cost of executing the query during the last 30 seconds. The live cost is the time spent processing active (not yet archived) data. |
| Status | The current status of the query. A Live query is one actively being processed, for example as part of a dashboard or automation. Static queries are queries that have finished executing within a search. |
| Age | The time since the query was started. For a live query, this will show the time since the query was first executed. |
| View | Which dashboard, view or repository was used to execute the query. |
| Initiated by | The email address of the user that initiated the query. |
| If the Show additional query details columns toggle has been enabled, the following additional columns are shown: | |
| Static CPU | CPU time spent fetching archived data to execute the query. |
| Live CPU | CPU time spent processing active data for the query. |
| Total MA | Total Memory allocated in order to complete the query. |
Selecting a given process from the table allows you to display more detailed information. This detailed information is shown in tabs at the bottom of the query list table.
Query
          Stats
shows more detailed statistics about an
individual query than the main table. The panel displays the following
fields:
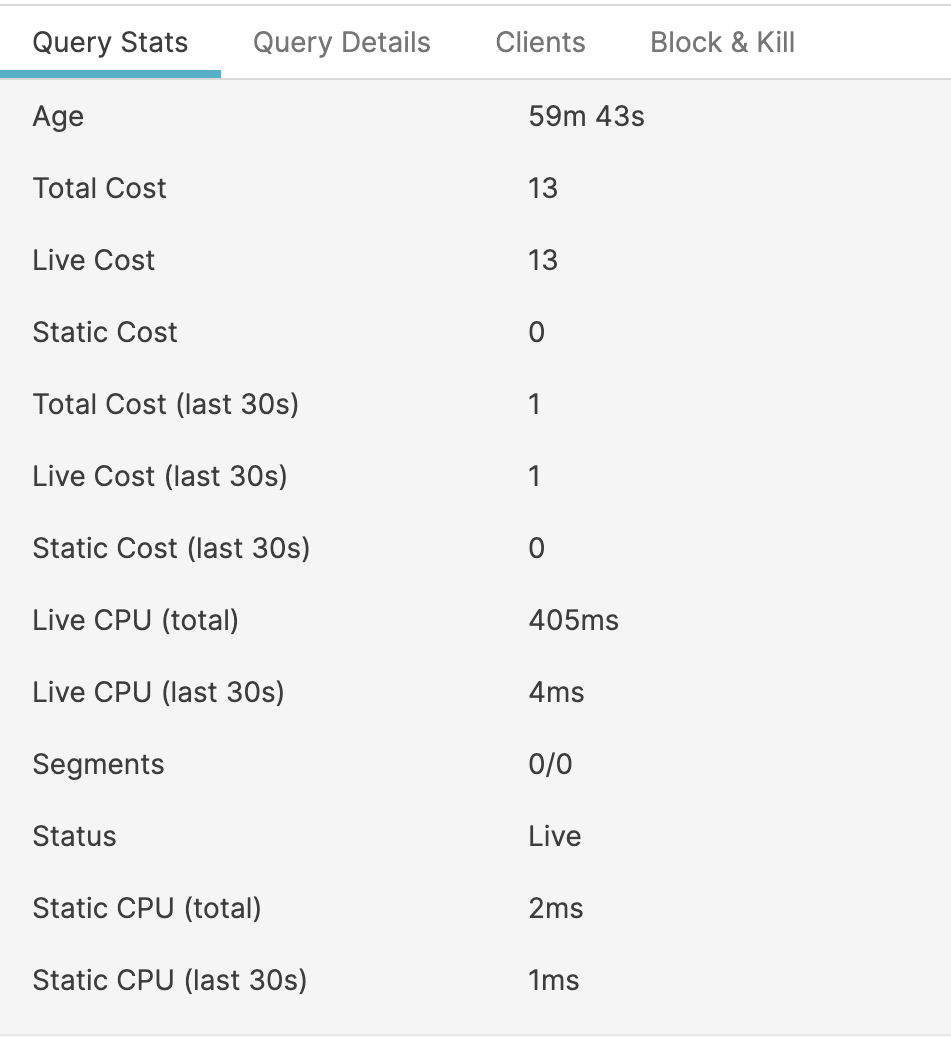 |
Figure 14. Query Monitor Query Stats Panel
| Column | Description |
|---|---|
| Age | The time since the query was started. For a live query, this will show the time since the query was first executed. |
| Total Cost | Overall cost of executing the query in the last 30 seconds. The query cost is calculated as a combination of the CPU and memory requirements for a given query, and can be used as a simple comparison cost value when comparing queries against each other. However, it is best to check the specific CPU and memory requirements to get an accurate idea of the resources being used. |
| Live Cost | The live cost of executing the query during the last 30 seconds. The live cost is the time spent processing active (not yet archived) data. |
| Static Cost | The static cost of executing the query during the last 30 seconds. The static cost is a measure of the effort by the cluster to process historic (archived) data to perform the query. |
| Total Cost (last 30s) [a] | Total cost during the last 30 seconds. |
| Live Cost (last 30s) [a] | Live cost during the last 30 seconds. |
| Static Cost (last 30s) [a] | Static cost during the last 30 seconds. |
| Segments | Number of segments loaded for this query. |
| Status | The current status of the query. A Live query is one actively being processed, for example as part of a dashboard or automation. Static queries are queries that have finished executing within a search. |
| Static CPU | CPU time spent fetching archived data to execute the query. |
| Static CPU (last 30s) [a] | CPU time spent fetching archived data to execute the query during the last 30 seconds. |
| Total Memory Allocation | Total Memory allocated in order to complete the query. |
| Total Memory Allocation (last 30s) [a] | Total Memory allocated in order to complete the query in the last 30 seconds. |
[a] Where the statistic shows the last 30s, this is 30 seconds compared to the current time (not when the query executed). This can be used to monitor whether the memory allocation is increasing, or whether an active query is continuing to need additional memory. | |
Query
          details
displays detailed information about the query,
including the full query text execution context:
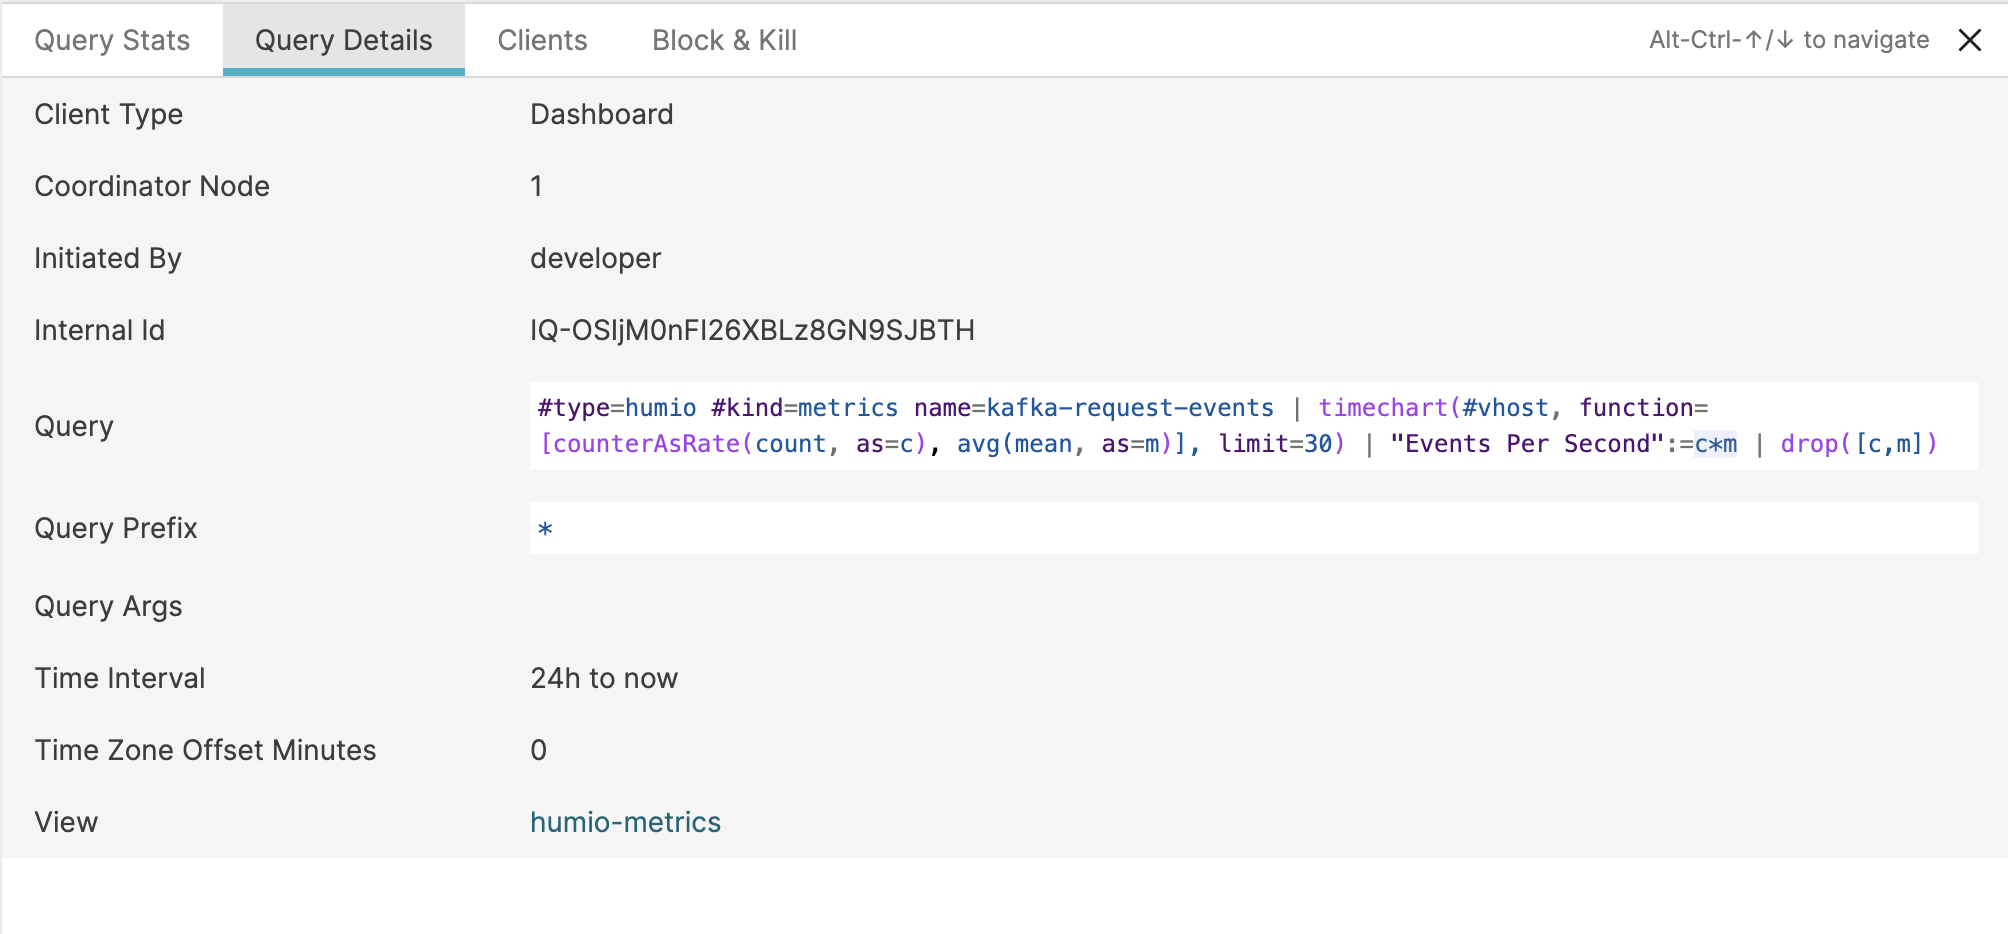 |
Figure 15. Query Monitor Query Details Panel
| Column | Description |
|---|---|
| Client Type | The type of the client that initiated the query, for example Dashboards or a User query. |
| Coordinator Node | The coordinator node that coordinated the execution of the query. |
| Initiated By | The user that initiated the query. |
| Internal Id | The unique internal ID for the query execution. |
| Query | The text of the Query. |
| Query prefix | The prefix applied to the query. |
| Query arguments | Any arguments applied to the query as part of a widget or dashboard. |
| Time Interval | The time interval used when the query was executed. For example, in a dashboard or search environment this will match the time interval setting. |
| Time Zone Offset Minutes | The time zone offset for the query from the configured cluster time. |
| View | The view or repository for the query. |
Clients
provides a table of the clients that are responsible for executing the
query. It's possible that more than one client may be responsible for
executing a specific query. For example, if a given dashboard has been
opened by multiple clients, the queries for a given widget are
executed only once for each widget. The table shows three columns:
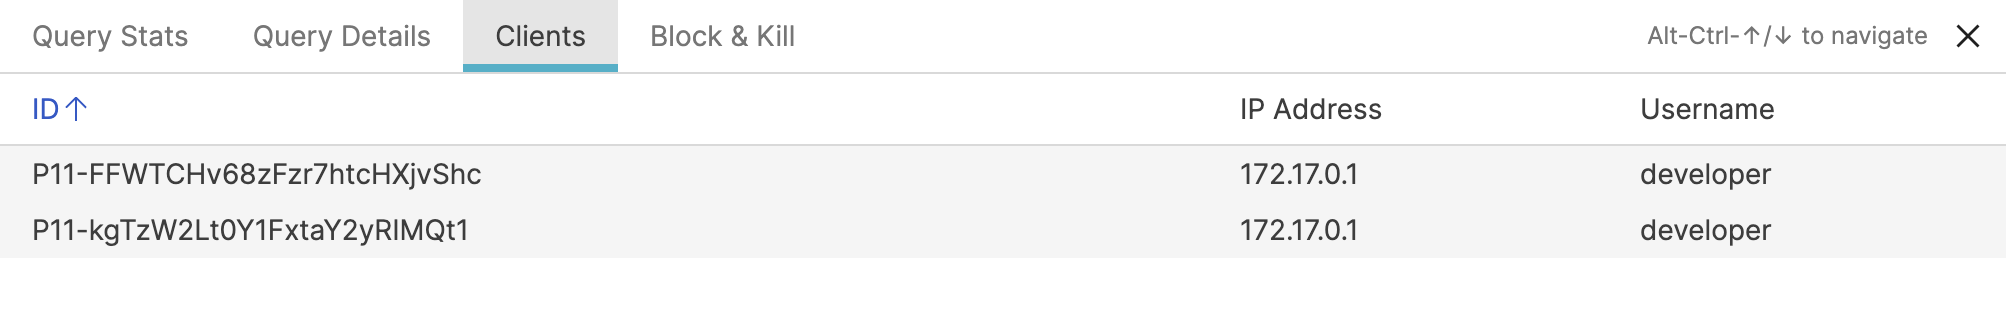 |
Figure 16. Query Monitor Clients Panel
| Column | Description |
|---|---|
| ID | A unique, internal ID for the client. |
| IP Address | The IP address for each client executing this query. |
| Username | The username that initiated this query. |
The Block and
Kill panel allows you to kill a currently running
query or to block the execution of the query in the future.
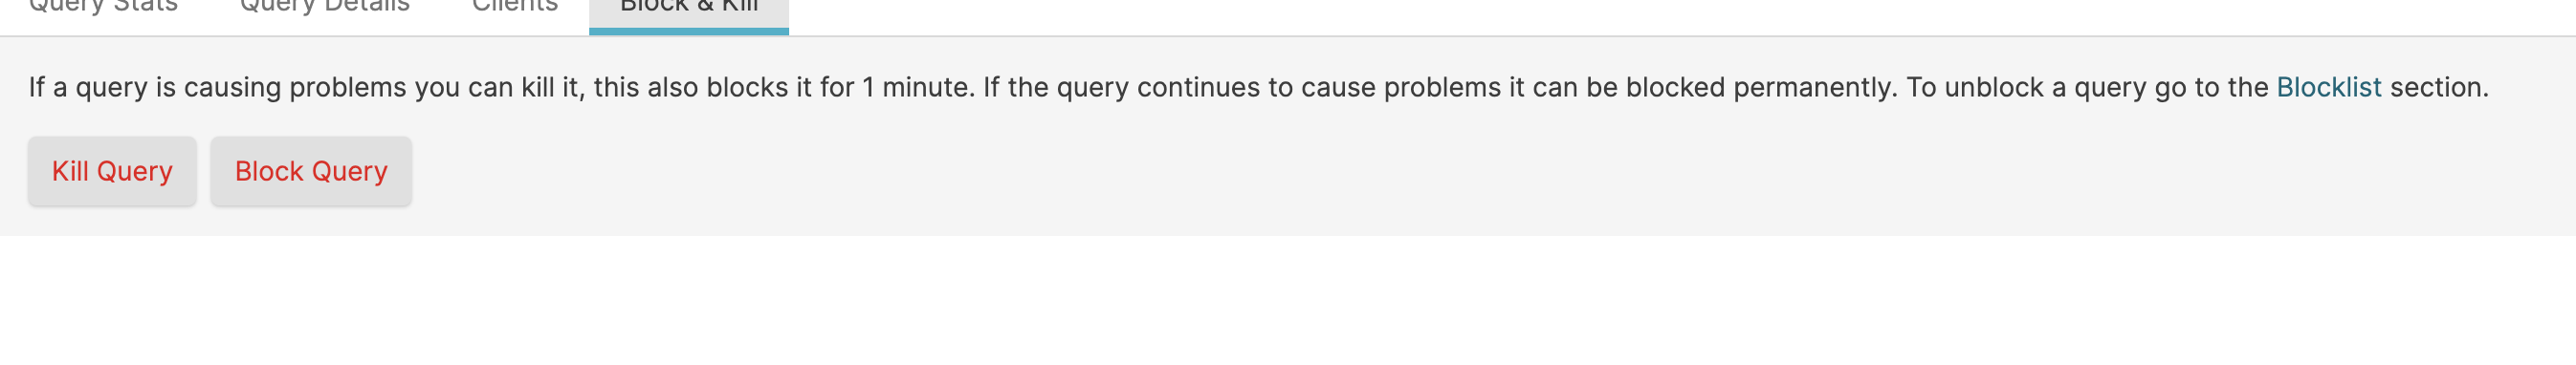 |
Figure 17. Query Monitor Block and Kill Panel
Kill a running query
Killing a running query terminates the current execution. In general this option is used when you want to stop the query because it is taking too many resources or running for too long.
Before killing a query, check the
Query
            Stats
and
Query
            Details
panels to ensure that you are killing the
correct query. Be aware that killing the query will block all
executions of the query where it's used and may cause the output of
widgets and automations to fail if they use the query.
To kill a query:
Select the query from
Query Monitorpanel.Check the
Query StatsandQuery Detailspanels.When ready, click the button.
A message will be displayed at the bottom of the page to indicate that the query has been killed.
Important
Streaming Aggregate Queries will not be shown in the list of running queries, and they are not canceled by the button. These queries can only be canceled by rebooting LogScale nodes.
Block a query
When blocking a query using this panel, the query block that is added uses the full query string against the specific View or Repository that the currently selected query is executing against. This is identical to creating a text match query to a specific Repository within the Add Query to Blocklist page.
To block a query:
Check the
Query StatsandQuery Detailspanels.Click .
A message appears at the bottom of the page to indicate that the query has been blocked.