
Query Monitor — Query Details
The Query details
panel displays detailed information about the query, including the
full query text execution context:
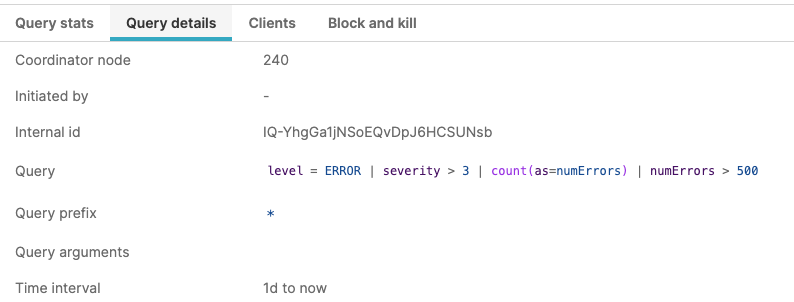 |
Figure 9. Query Monitor Query Details Panel
Coordinator Node
The coordinator node that coordinated the execution of the query.
Initiated By
The user that initiated the query.
Internal Id
The unique internal Id for the query execution.
Query
The text of the Query.
Query Prefix
The prefix applied to the query.
Query Args
Any arguments applied to the query as part of a widget or dashboard.
Time Interval
The time interval used when the query was executed. For example, in a dashboard or search environment this will match the time interval setting.
Time Zone Offset Minutes
The time zone offset for the query from the configured cluster time.
View
The view or repository for the query.