
Manage Fields
You can manage fields from two different areas of the web interface: the Fields Panel and the Format Event List Panel.
The Fields panel allows you to:
Display all fields, see Display Fields for more information.
Select individual fields to search and filter on those fields. Click a field to open a resizable flyout that shows the list of values for that field and the number of occurrences for each value:
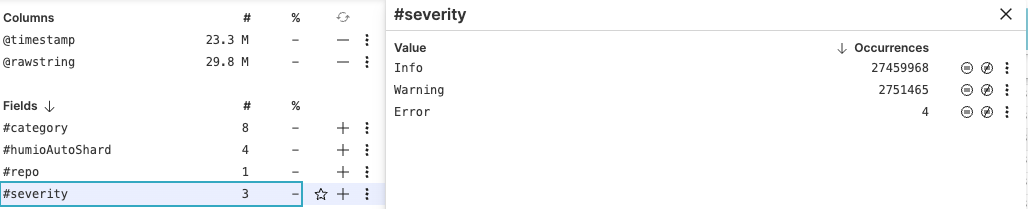
Figure 81. Select Fields
When the menu is opened during live queries, the Fields panel flyout will display a fixed list of top values. These top values are kept from the point in time when the menu was opened. See Field Interactions for more information.
Exclude value or match value fields. You can select these options through the fields flyout popping up when you click on a field.
Access several filtering options. Click the three-dot icon next to a field:
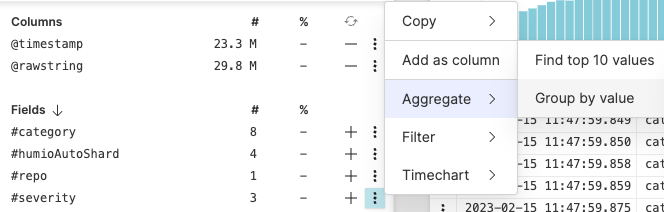
Figure 82. Filtering Options
For example, you can select → to group events by the value of that field, or → to run the
timeChart()function in theQuery Editorand show events that have that field grouped into series and plotted in a timechart.Add and remove fields to optimize the data visualized: click the or signs next to each field in the Fields panel.
The Format Event List panel allows you to format the fields available in the Event List (their properties, size, etc.). You can open it by clicking the style icon , as shown in Figure 83, “Expanding the Format Event List Panel”:
The Format Event List panel stands as a separate area on the side and shows only the fields added as columns in the Event list.
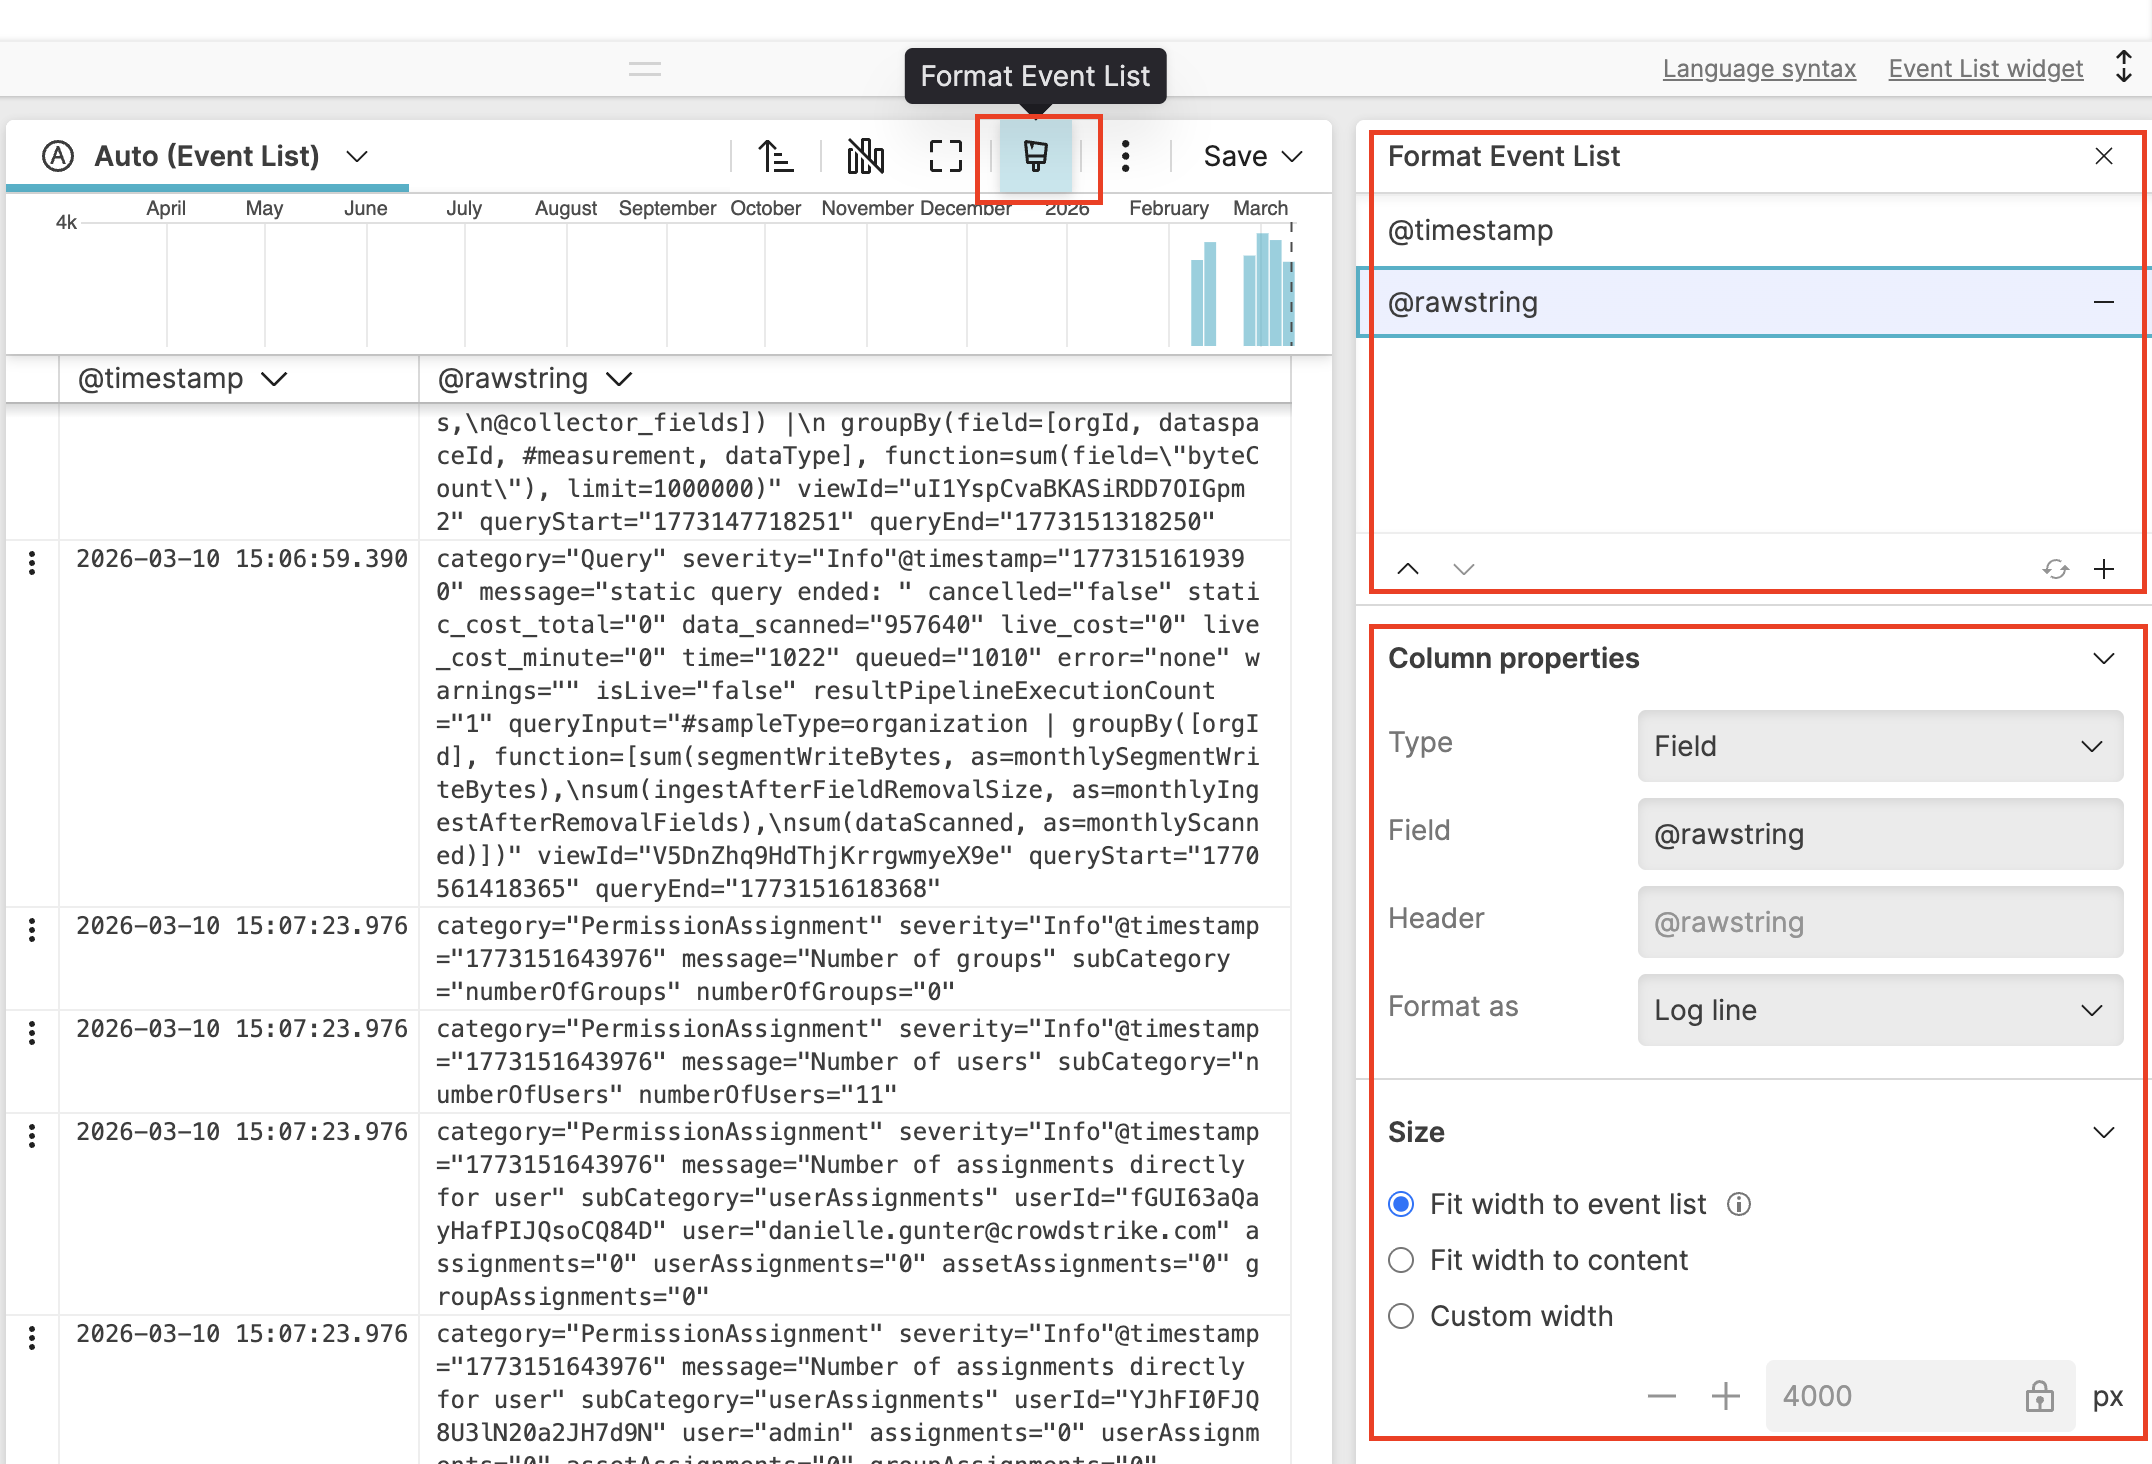 |
Figure 83. Expanding the Format Event List Panel
Click to add a new column in the Event List and format the field accordingly.
Clicking removes the field from the currently displayed result. See Column Properties.