Query Monitor — Clients

The Clients panel provides a table of the clients that are responsible for executing the query. It's possible that more than one client may be responsible for executing a specific query. For example, if a given dashboard has been opened by multiple clients, the queries for a given widget are executed only once for each widget. The table shows three columns:
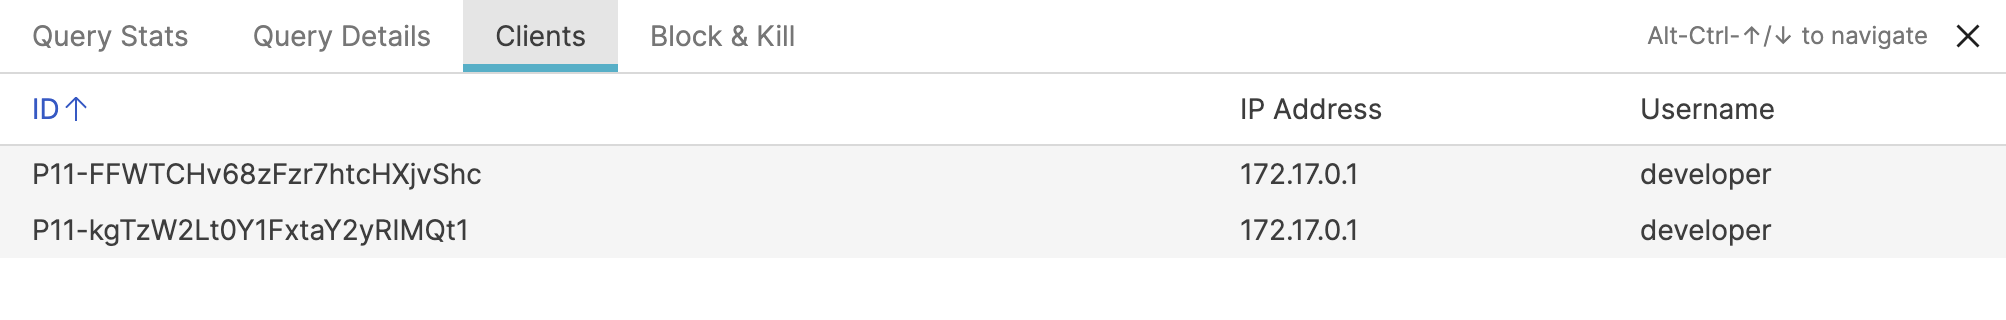
Screenshot of the Query Monitor Clients Panel in LogScale's administration interface showing a tabular view of clients executing the currently selected query. The panel displays three columns of information: Client ID (showing unique internal identifiers), IP Address (displaying the network addresses of connected clients), and Username (indicating which user accounts initiated the query). This interface allows administrators to identify which users and systems are responsible for executing specific queries, supporting troubleshooting efforts and resource usage analysis when multiple clients might be executing the same query simultaneously, such as when a dashboard is opened by multiple users.

Figure 7. Query Monitor Clients Panel


  • ID

    A unique, internal, ID for the client.

  • IP Address

    The IP address for each client executing this query.

  • Username

    The username that initiated this query.