
Query Monitor — Query Stats
The Query Stats panel shows more detailed statistics about an individual query than the main table. The panel displays the following fields:
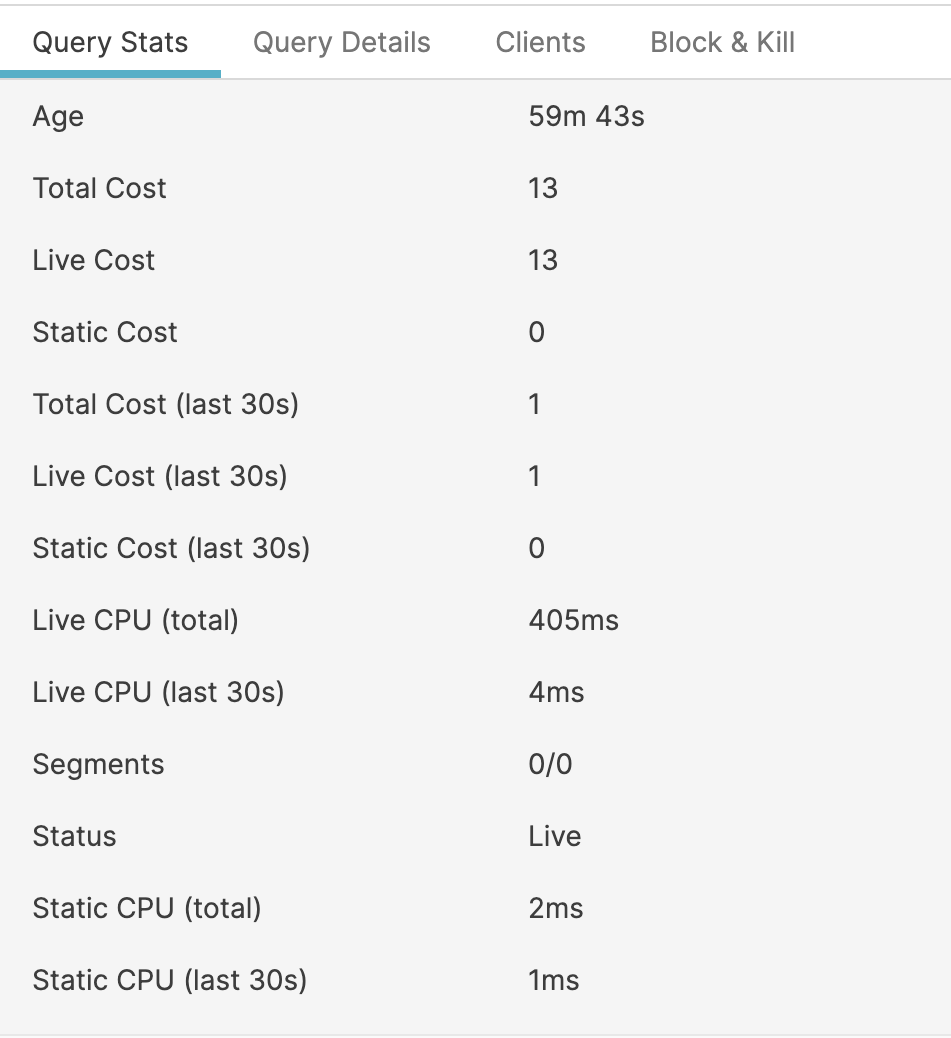 |
Figure 10. Query Monitor Query Stats Panel
Age
The time since the query was started. For a live query, this will show the time since the query was first executed.
Total Cost
Overall cost of executing the query in the last 30 seconds. The query cost is calculated as a combination of the CPU and memory requirements for a given query. The value can be used comparison cost value when comparing queries against each other. However, it is best to check the specific CPU and memory requirements to get an accurate idea of the resources being used.
Live Cost
The live cost of executing the query during the last 30 seconds. The live cost the time spent processing active (not yet archived) data.
Static Cost
The static cost of executing the query during the last 30 seconds. The static cost is a measure of the effort by the cluster to process historic (archived) data to perform the query.
Total Cost (last 30s)
Total cost during the last 30 seconds.
Live Cost (last 30s)
Live cost during the last 30 seconds.
Static Cost (last 30s)
Static cost during the last 30 seconds.
Segments
Number of segments loaded for this query.
Status
The current status of the query. A Live query is one actively being processed, for example as part of a dashboard or automation. Static queries are queries that have finished executing within a search.
Static CPU
CPU time spent fetching archived data to execute the query.
Static CPU (last 30s)
CPU time spent fetching archived data to execute the query during the last 30 seconds.
Total Memory Allocation
Total Memory allocated in order to complete the query.
Total Memory Allocation (last 30s)
Total Memory allocated in order to complete the query in the last 30 seconds.
Where the statistic shows the last 30s, this is 30 seconds compared to the current time (not when the query executed). This can be used to monitor whether the memory allocation is increasing, or whether an active query is continuing to need additional memory.