
Manage Widgets
Once a widget is created within a dashboard, there are several actions you can perform with it.
Click the three-dot menu icon ⋮ on the upper right corner of each widget to access a series of functionalities:
— takes you to Editing Widget mode in the Search tab, where you can edit the query for your widget. The query will use the live setting of the dashboard, and the values set in parameters in the query are also carried over into the search view.
— opens the Styling panel, where you can modify the properties for a different look&feel of the widget. For details on each widget's specific properties, see Widgets.
— opens the Interactions panel for that widget. See Manage Dashboard Interactions for details.
— creates an identical widget that will be saved in the dashboard as #2.
— deletes the widget from the dashboard.
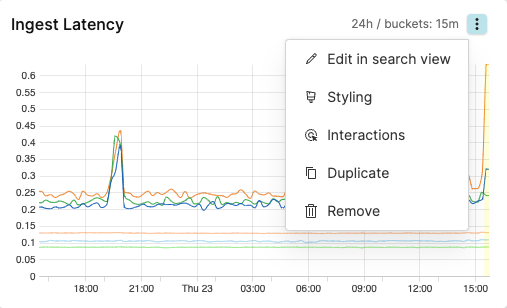 |
Figure 158. Edit Widgets
Click or to open the widget's side panel and access the icon menu:
Widget changes the widget's title and description, as well as the default widget time.
Styling changes the layout properties of the widget.
Interactions configures Manage Dashboard Interactions.
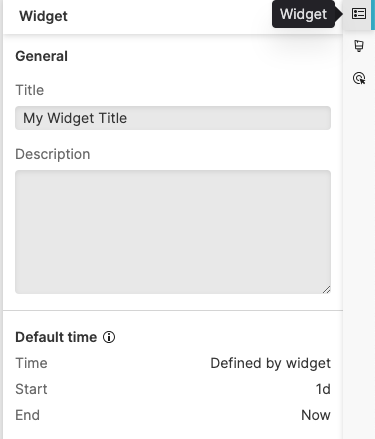 |
Figure 159. Widget Menu
Widgets with Live join() Functions
There is a known limitation about join() functions
that are not supported when running in live queries — the details
are explained at
Join Operation and Optimization.
This limitation causes these queries not truly running live in your widget, but running repeatedly instead, to show results that are as recent as possible.
When you create a widget with such a query, an indicator in the User Interface notifies you on how old the query is — that is, when it was the last time it has been executed (Just now, 1 minute ago, etc.):
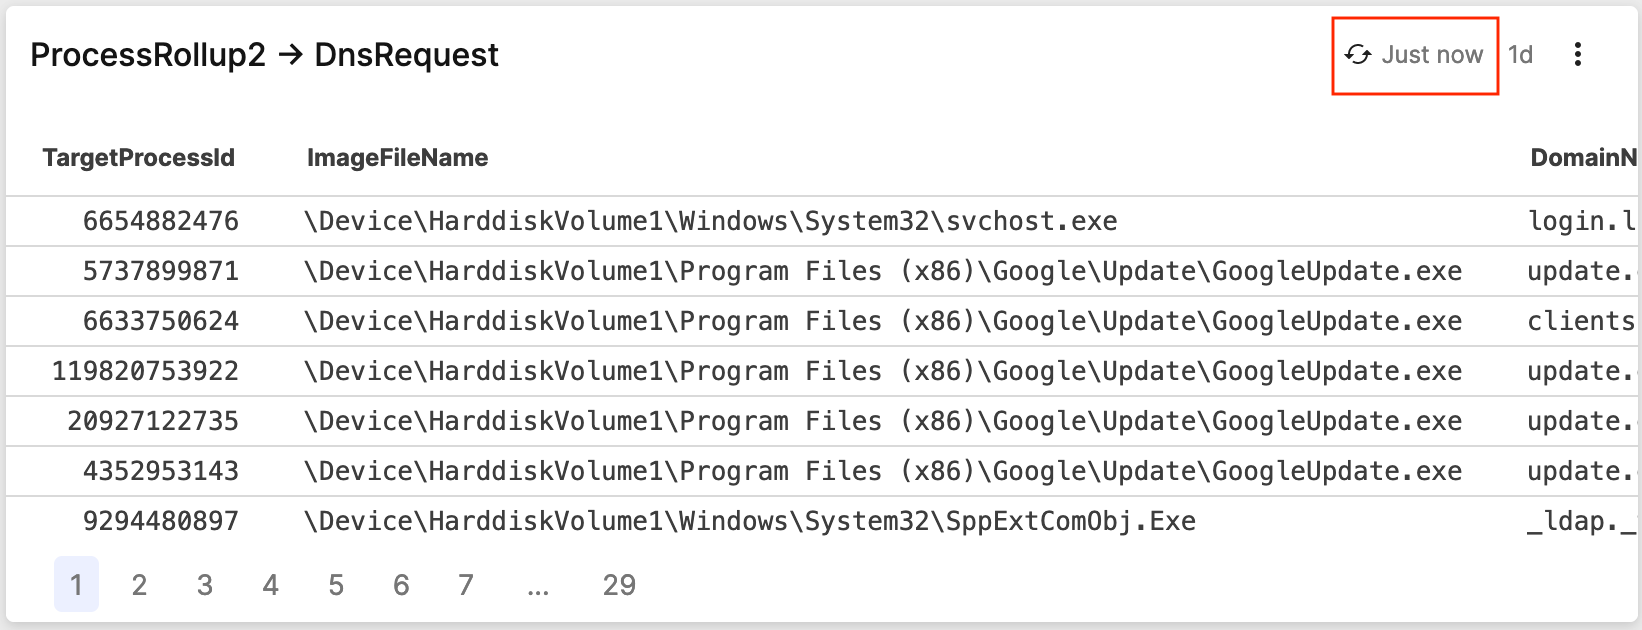 |
Figure 160. Repeated Query Indicator