
zscaler/internet-access Dashboards
The Zscaler Internet Access Web - Threat Activity dashboard provides comprehensive visibility into web-based security threats and malicious activities through interconnected visualizations. This dashboard enables monitoring of threat patterns, analysis of attack vectors, and response to web security incidents across the environment.
The Zscaler Internet Access Web - User Investigation dashboard provides detailed insights into user web behaviors and potential security violations through correlated data visualizations. This dashboard enables investigation of suspicious activities, tracking of policy violations, and identification of risky web access patterns.
The Zscaler Internet Access Web - Web Activity dashboard provides real-time visibility into overall web traffic patterns and usage metrics through integrated visualizations. This dashboard enables monitoring of web access trends, analysis of bandwidth consumption, and tracking of application usage across the environment.
Web - Threat Activity
The Zscaler Internet Access Web - Threat Activity dashboard provides comprehensive visibility into web-based security threats and malicious activities through interconnected visualizations. This dashboard enables monitoring of threat patterns, analysis of attack vectors, and response to web security incidents across the environment.
 |
| Widget | Description | Type |
|---|---|---|
Displays a pie chart of a user's top blocked DLP dictionaries.
| Pie Chart | |
Displays a chart of top CrowdStrike IOC hits by threat actor and
limits results to the first 10 entries.
| Time Chart | |
Displays a table of CrowdStrike IOC enrichment data regarding the
destination domain and associated data (user email, IOC domain,
etc) then limits results to the first 1000 entries.
| Table | |
Displays a chart of the top 10 vendor threat names.
| Time Chart | |
Displays a pie chart of top CrowdStrike IOCs by confidence.
| Pie Chart | |
Displays a pie chart of top blocked DLP engines.
| Pie Chart | |
Displays a table of CrowdStrike IOC enrichment instances and
server IPs and limits results to the first 1000 entries.
| Table | |
Displays a pie chart of the top CrowdStrike IOCs by country.
| Pie Chart | |
Displays a pie chart of the top threat names via username and user
email.
| Pie Chart | |
Displays a flow chart of top vendor categories to threat names.
| Sankey |
Web - User Investigation
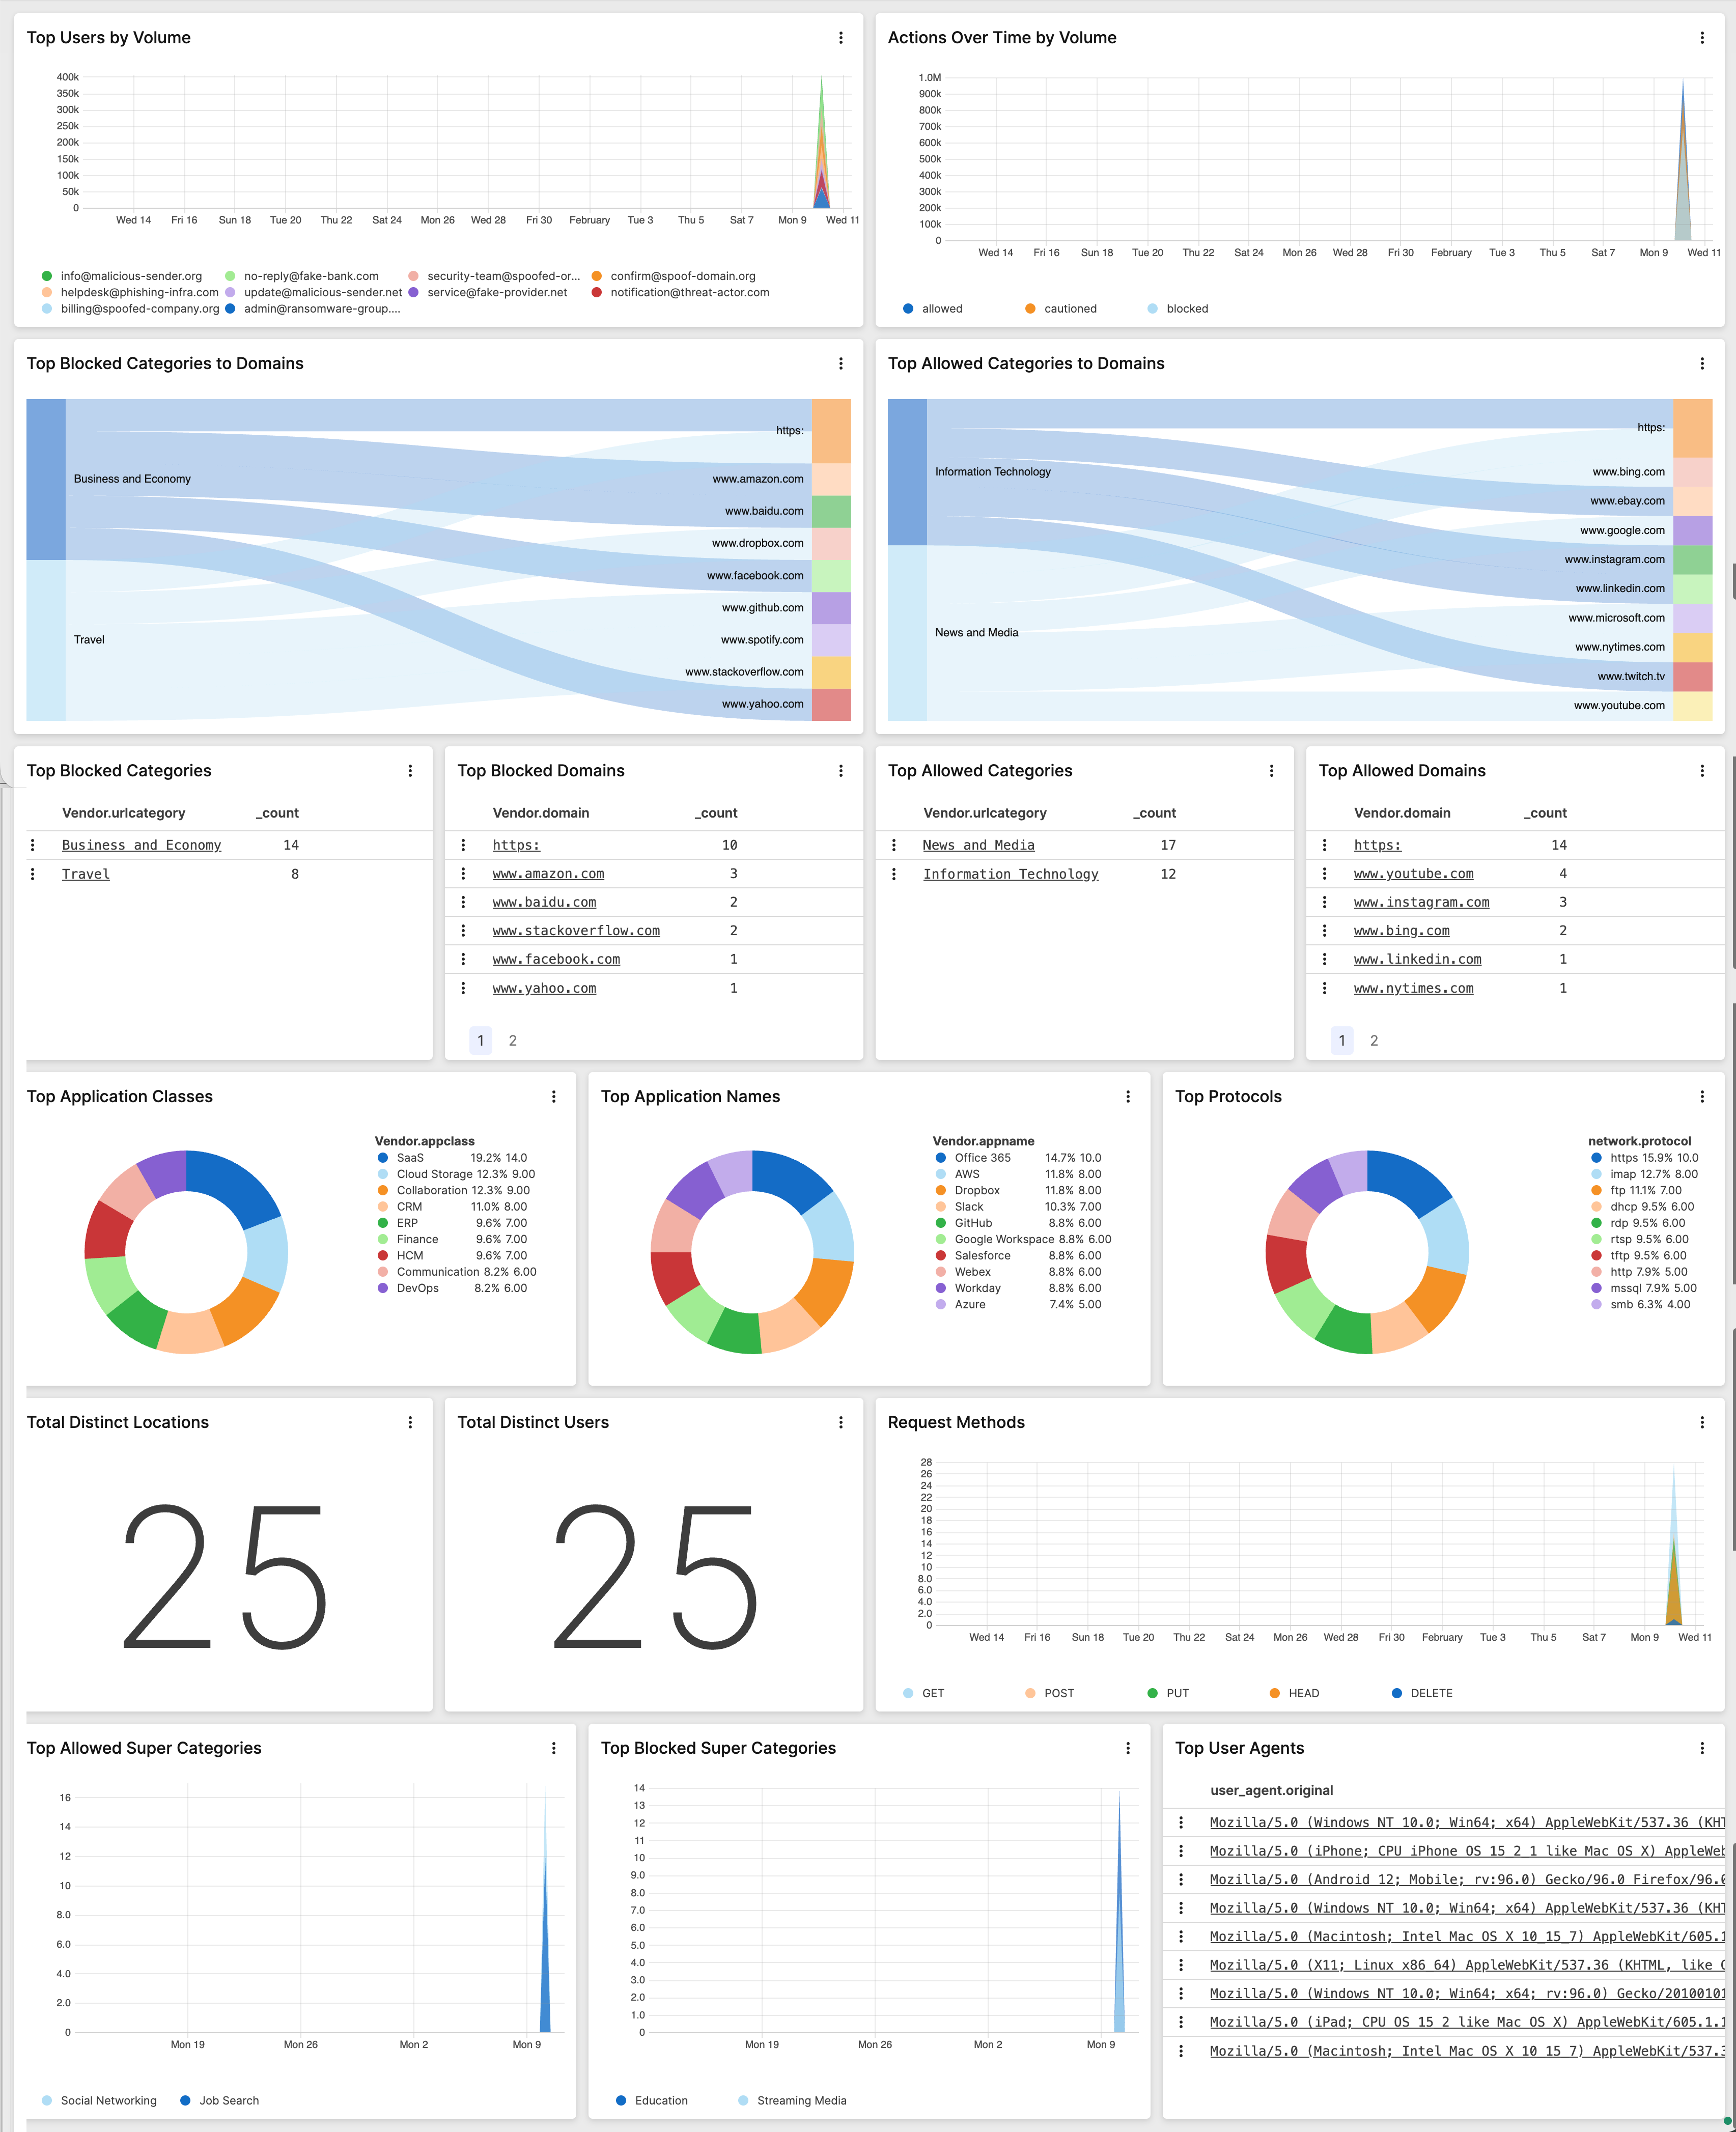
The Zscaler Internet Access Web - User Investigation dashboard provides detailed insights into user web behaviors and potential security violations through correlated data visualizations. This dashboard enables investigation of suspicious activities, tracking of policy violations, and identification of risky web access patterns.
| Widget | Description | Type |
|---|---|---|
Displays a pie chart of a user's top blocked DLP dictionaries.
| Pie Chart | |
Displays a chart of top users by volume using user email data,
then limits the results to the first 10 entries.
| Time Chart | |
Displays a chart of top CrowdStrike IOC hits by threat actor and
limits results to the first 10 entries.
| Time Chart | |
Displays the number of total distinct users and their email
addresses.
| Single Value | |
Displays a table of CrowdStrike IOC enrichment data regarding the
destination domain and associated data (user email, IOC domain,
etc) then limits results to the first 1000 entries.
| Table | |
Displays a user's top allowed domains based on their email
address.
| Table | |
Displays a chart of top allowed super categories by user email,
and limits results to the first 10 entries.
| Time Chart | |
Displays a list of a users top blocked domains by username and
email address.
| Table | |
Displays a chart of the top 10 vendor threat names.
| Time Chart | |
Displays a pie chart of top applications names.
| Pie Chart | |
Displays a chart of top blocked super categories over time then
limits results to the first 10 entries.
| Time Chart | |
Displays a list of top user agents by user email address and
limits the results to the first 100 entries.
| Table | |
Displays a pie chart of top CrowdStrike IOCs by confidence.
| Pie Chart | |
Displays a pie chart of top blocked DLP engines.
| Pie Chart | |
Displays a pie chart of top network protocols.
| Pie Chart | |
Displays a table of CrowdStrike IOC enrichment instances and
server IPs and limits results to the first 1000 entries.
| Table | |
Displays a flow chart of top allowed URL categories and vendor
domains, then limits results to the first 20 entries.
| Sankey | |
Displays a table of top allowed URL categories by user email.
| Table | |
Displays a pie chart of the top CrowdStrike IOCs by country.
| Pie Chart | |
Displays a flowchart of top blocked categories by domain name.
| Sankey | |
Displays a pie chart of top application classes using Zscaler
data.
| Pie Chart | |
Displays a pie chart of the top threat names via username and user
email.
| Pie Chart | |
Displays a list top blocked categories based on a user's email
address.
| Table | |
Displays a list of HTTP request methods by username and email.
| Time Chart | |
Displays a list of user actions over time by volume based on user
email.
| Time Chart | |
Displays a flow chart of top vendor categories to threat names.
| Sankey | |
Displays the number of total distinct locations by username.
| Single Value |
Web - Web Activity
The Zscaler Internet Access Web - Web Activity dashboard provides real-time visibility into overall web traffic patterns and usage metrics through integrated visualizations. This dashboard enables monitoring of web access trends, analysis of bandwidth consumption, and tracking of application usage across the environment.
| Widget | Description | Type |
|---|---|---|
Displays a chart of top users by volume using user email data,
then limits the results to the first 10 entries.
| Time Chart | |
Displays the number of total distinct users and their email
addresses.
| Single Value | |
Displays a user's top allowed domains based on their email
address.
| Table | |
Displays a chart of top allowed super categories by user email,
and limits results to the first 10 entries.
| Time Chart | |
Displays a list of a users top blocked domains by username and
email address.
| Table | |
Displays a pie chart of top applications names.
| Pie Chart | |
Displays a chart of top blocked super categories over time then
limits results to the first 10 entries.
| Time Chart | |
Displays a list of top user agents by user email address and
limits the results to the first 100 entries.
| Table | |
Displays a pie chart of top network protocols.
| Pie Chart | |
Displays a flow chart of top allowed URL categories and vendor
domains, then limits results to the first 20 entries.
| Sankey | |
Displays a table of top allowed URL categories by user email.
| Table | |
Displays a flowchart of top blocked categories by domain name.
| Sankey | |
Displays a pie chart of top application classes using Zscaler
data.
| Pie Chart | |
Displays a list top blocked categories based on a user's email
address.
| Table | |
Displays a list of HTTP request methods by username and email.
| Time Chart | |
Displays a list of user actions over time by volume based on user
email.
| Time Chart | |
Displays the number of total distinct locations by username.
| Single Value |