
docker/metrics Dashboards
The Docker Overview dashboard provides comprehensive container performance monitoring through integrated metric visualizations. This dashboard enables tracking of container health status, analysis of resource utilization patterns, and monitoring of Docker infrastructure performance across the containerized environment.
Docker Overview
The Docker Overview dashboard provides comprehensive container performance monitoring through integrated metric visualizations. This dashboard enables tracking of container health status, analysis of resource utilization patterns, and monitoring of Docker infrastructure performance across the containerized environment.
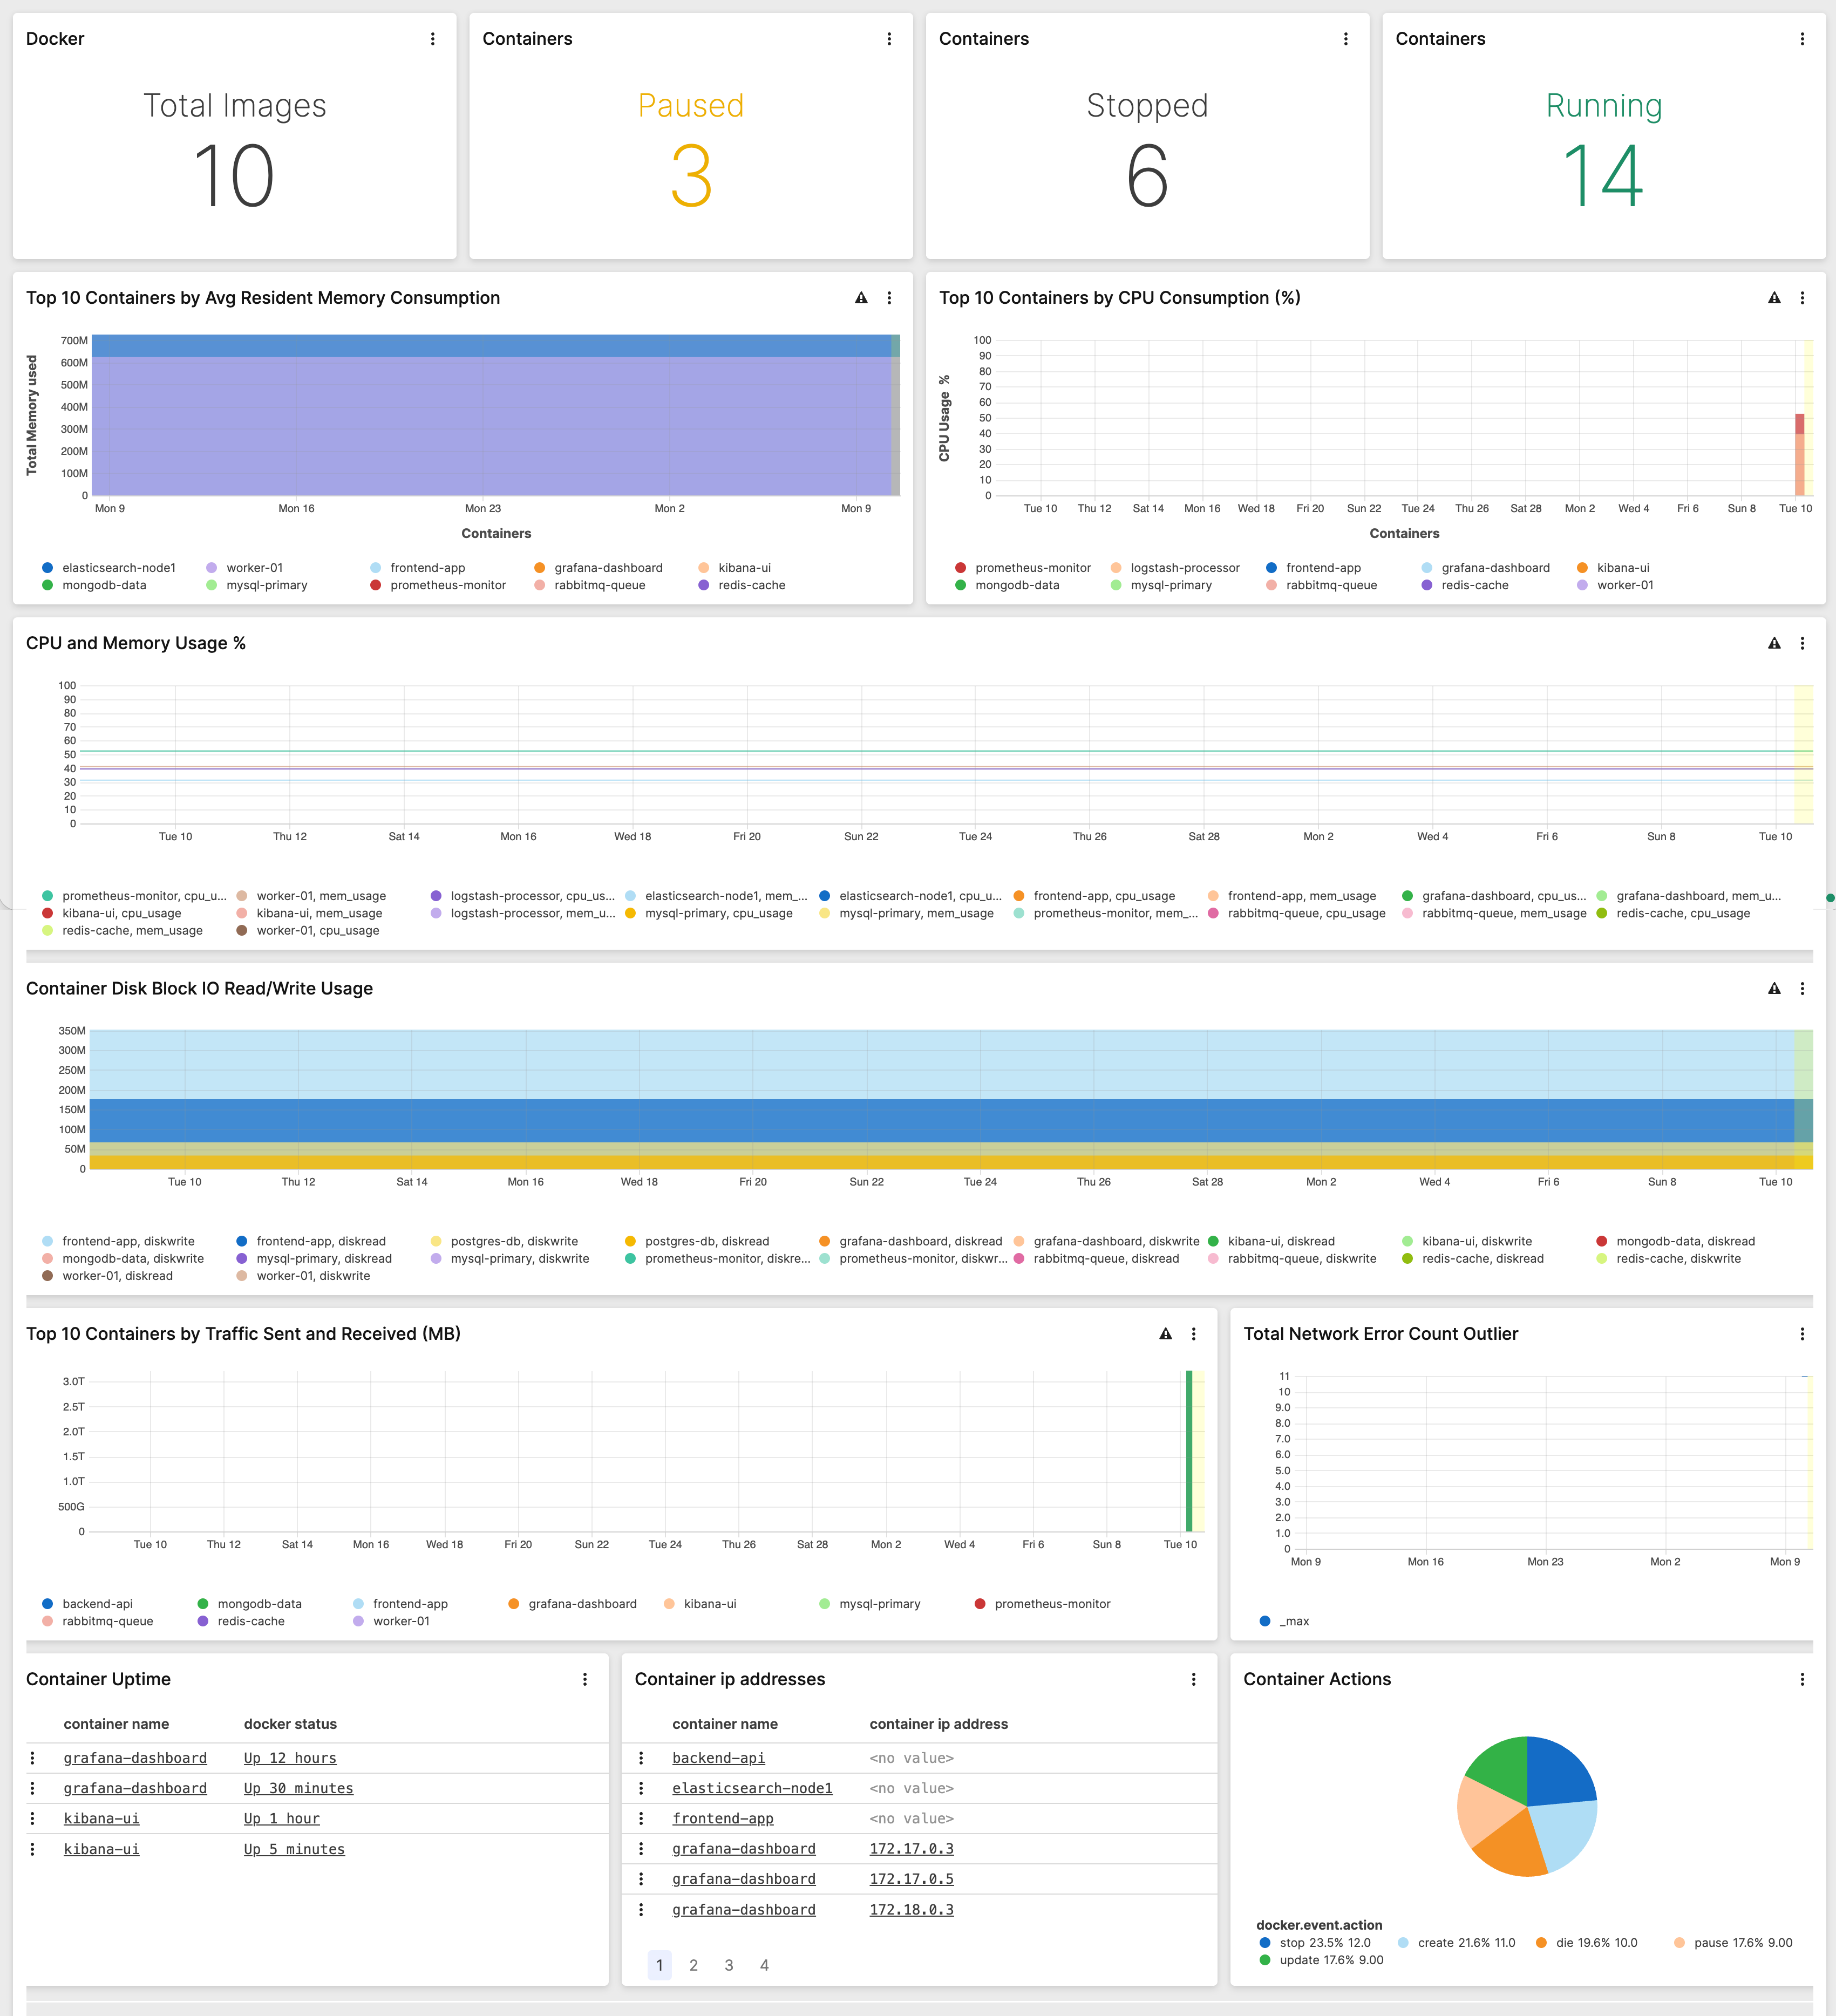 |
| Widget | Description | Type |
|---|---|---|
Displays a table of Docker container uptime statuses by container.
| Table | |
Displays a list of Docker container actions.
| Pie Chart | |
Displays a table of Docker container IP addresses and container
names.
| Table | |
Displays a list of Docker images.
| Gauge | |
Displays a list of the top 10 containers by sent and received
traffic in MB, then limits results to the first 10 entries.
| Time Chart | |
Displays a chart of the number of total Docker network outliers.
| Time Chart | |
Displays the number of paused Docker containers.
| Gauge | |
Displays a chart of CPU and memory usage in percentage format
using Docker data.
| Time Chart | |
Displays a list of container images.
| Gauge | |
Displays a chart of Docker container usage for disk block IO and
read/write operations.
| Time Chart | |
Displays stopped Docker container information.
| Gauge | |
Displays a chart of the top 10 Docker containers in descending
order based on CPU consumption in percentage format.
| Time Chart | |
Displays a chart of the top 10 Docker containers by average
resident memory consumption.
| Time Chart |