google/chrome-enterprise-security-events
| Vendor | Google LLC | Parsers | ✓ |
| Author | CrowdStrike | Dashboards | ✓ |
| Version | 1.2.1 | Alerts | ✗ |
| Minimum LogScale Version | 1.82.0 | Actions | ✗ |
| Use Cases | ITOps SecOps | Scheduled Searches | ✗ |
| Supported Log Formats |
| ||
| Security Domain | Web Security |
| Field | Format | Timezone |
|---|---|---|
| Vendor.time | seconds | UTC |
Organizations are now able to get additional visibility into managed Google Chrome Enterprise Browsers and Devices by ingesting the logs to LogScale where they can be searched, used to create dashboards and alerts and correlated with other ingested data from across the organization.
Breaking Changes
This update includes parser changes, which means that data ingested after upgrade will not be backwards compatible with logs ingested with the previous version.
Updating to version 1.0.0 or newer will therefore result in issues with existing queries in for example dashboards or alerts created prior to this version.
See CrowdStrike Parsing Standard (CPS) 1.1 for more details on the new parser schema.
How to configure the Integration
Sending the logs to LogScale is really simple, thanks to the Google Chrome Enterprise Connector Framework which allows organizations to push the logs direct to the LogScale Ingesting with HTTP Event Collector (HEC) ingest endpoint.
Preparations in LogScale
You will need to create a new repository for your Google Chrome data. If you aren't sure how to do this, see Creating a Repository or View.
Once you've created a new repository, click on the Settings tab and then Packages along the left-hand column. From there, chose Marketplace and search for, then install the LogScale package for google/chrome-enterprise.
When choosing the package, the README provides information about the package contents and other related information.
After installing the Package, from the repository where you want to ingest data, select Settings and Ingest choose API Tokens and create a new token and assign it the google-chrome-enterprise parser. Copy the ingest token.
Configuring Google to send the logs to LogScale
Google can only send the data from Chrome if it is first collecting the data which is done by enrolling the device in Chrome Enterprise. To find out more about how to enrol browsers with Chrome Enterprise see this Google Support article: https://support.google.com/chrome/a/answer/9301891?hl=en
Once browsers are enrolled to get the data to LogScale a Connector needs to be defined within the Google Chrome Enterprise Connector Framework. For detailed steps on how to configure this please see this Google Support article: https://support.google.com/chrome/a/answer/11375053
Log into the Google Administrator interface at admin.google.com
Note
You will need to log in as the organization administrator
Browse to Devices > Chrome > Connectors, Click the button.

Figure 20. New Provider Configuration
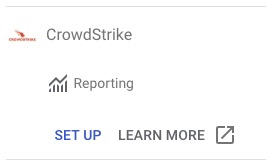
Click the Setup link for the CrowdStrike Connector

Figure 21. CrowdStrike Connector
Under the Configuration name field enter a recognizable name for the Connector. In the sample we are calling it
LogScale HEC.In the Ingest Token field insert the token which you copied earlier from within LogScale.
In the Host Name field enter the URL for the LogScale instance. Example:
instance.example.com:Note
If running Self-install LogScale (rather than LogScale Cloud) the HEC endpoint of your LogScale service must be internet reachable on port 443.
For the Default event types field, click the drop down and select Allow all.
Click the Add Configuration button to add the LogScale connector
Once the LogScale configuration is added it needs to be added to an organizational unit. It will look similar to below:
To configure the new connector to receive data browse to Devices → Chrome → Connectors
Click the checkbox for the new connector name. In the example here the name is
CrowdStrike - LogScale
                HEC
Click the button
You should now see your logs arriving in LogScale and the dashboards begin to populate with data.