
crowdstrike/siem-connector Dashboards
The Detections dashboard provides comprehensive visibility into security detections and alerts from CrowdStrike Falcon through a series of interconnected visualizations. This dashboard enables monitoring, analysis, and response to potential threats in the environment.
The Firewall Activity dashboard provides real-time visibility into network traffic patterns, security policy enforcement, and potential threats detected at the firewall level. This dashboard facilitates monitoring and analysis of network traffic behavior and security events across the environment.
The Summary dashboard serves as a high-level overview of security events, system health, and key metrics across the environment. This dashboard delivers a consolidated view of security posture and critical operational indicators.
The User Activity dashboard provides comprehensive visibility into user behavior, authentication events, and account-related activities across the environment. This dashboard facilitates monitoring of user actions, detection of suspicious behavior patterns, and tracking of authentication anomalies.
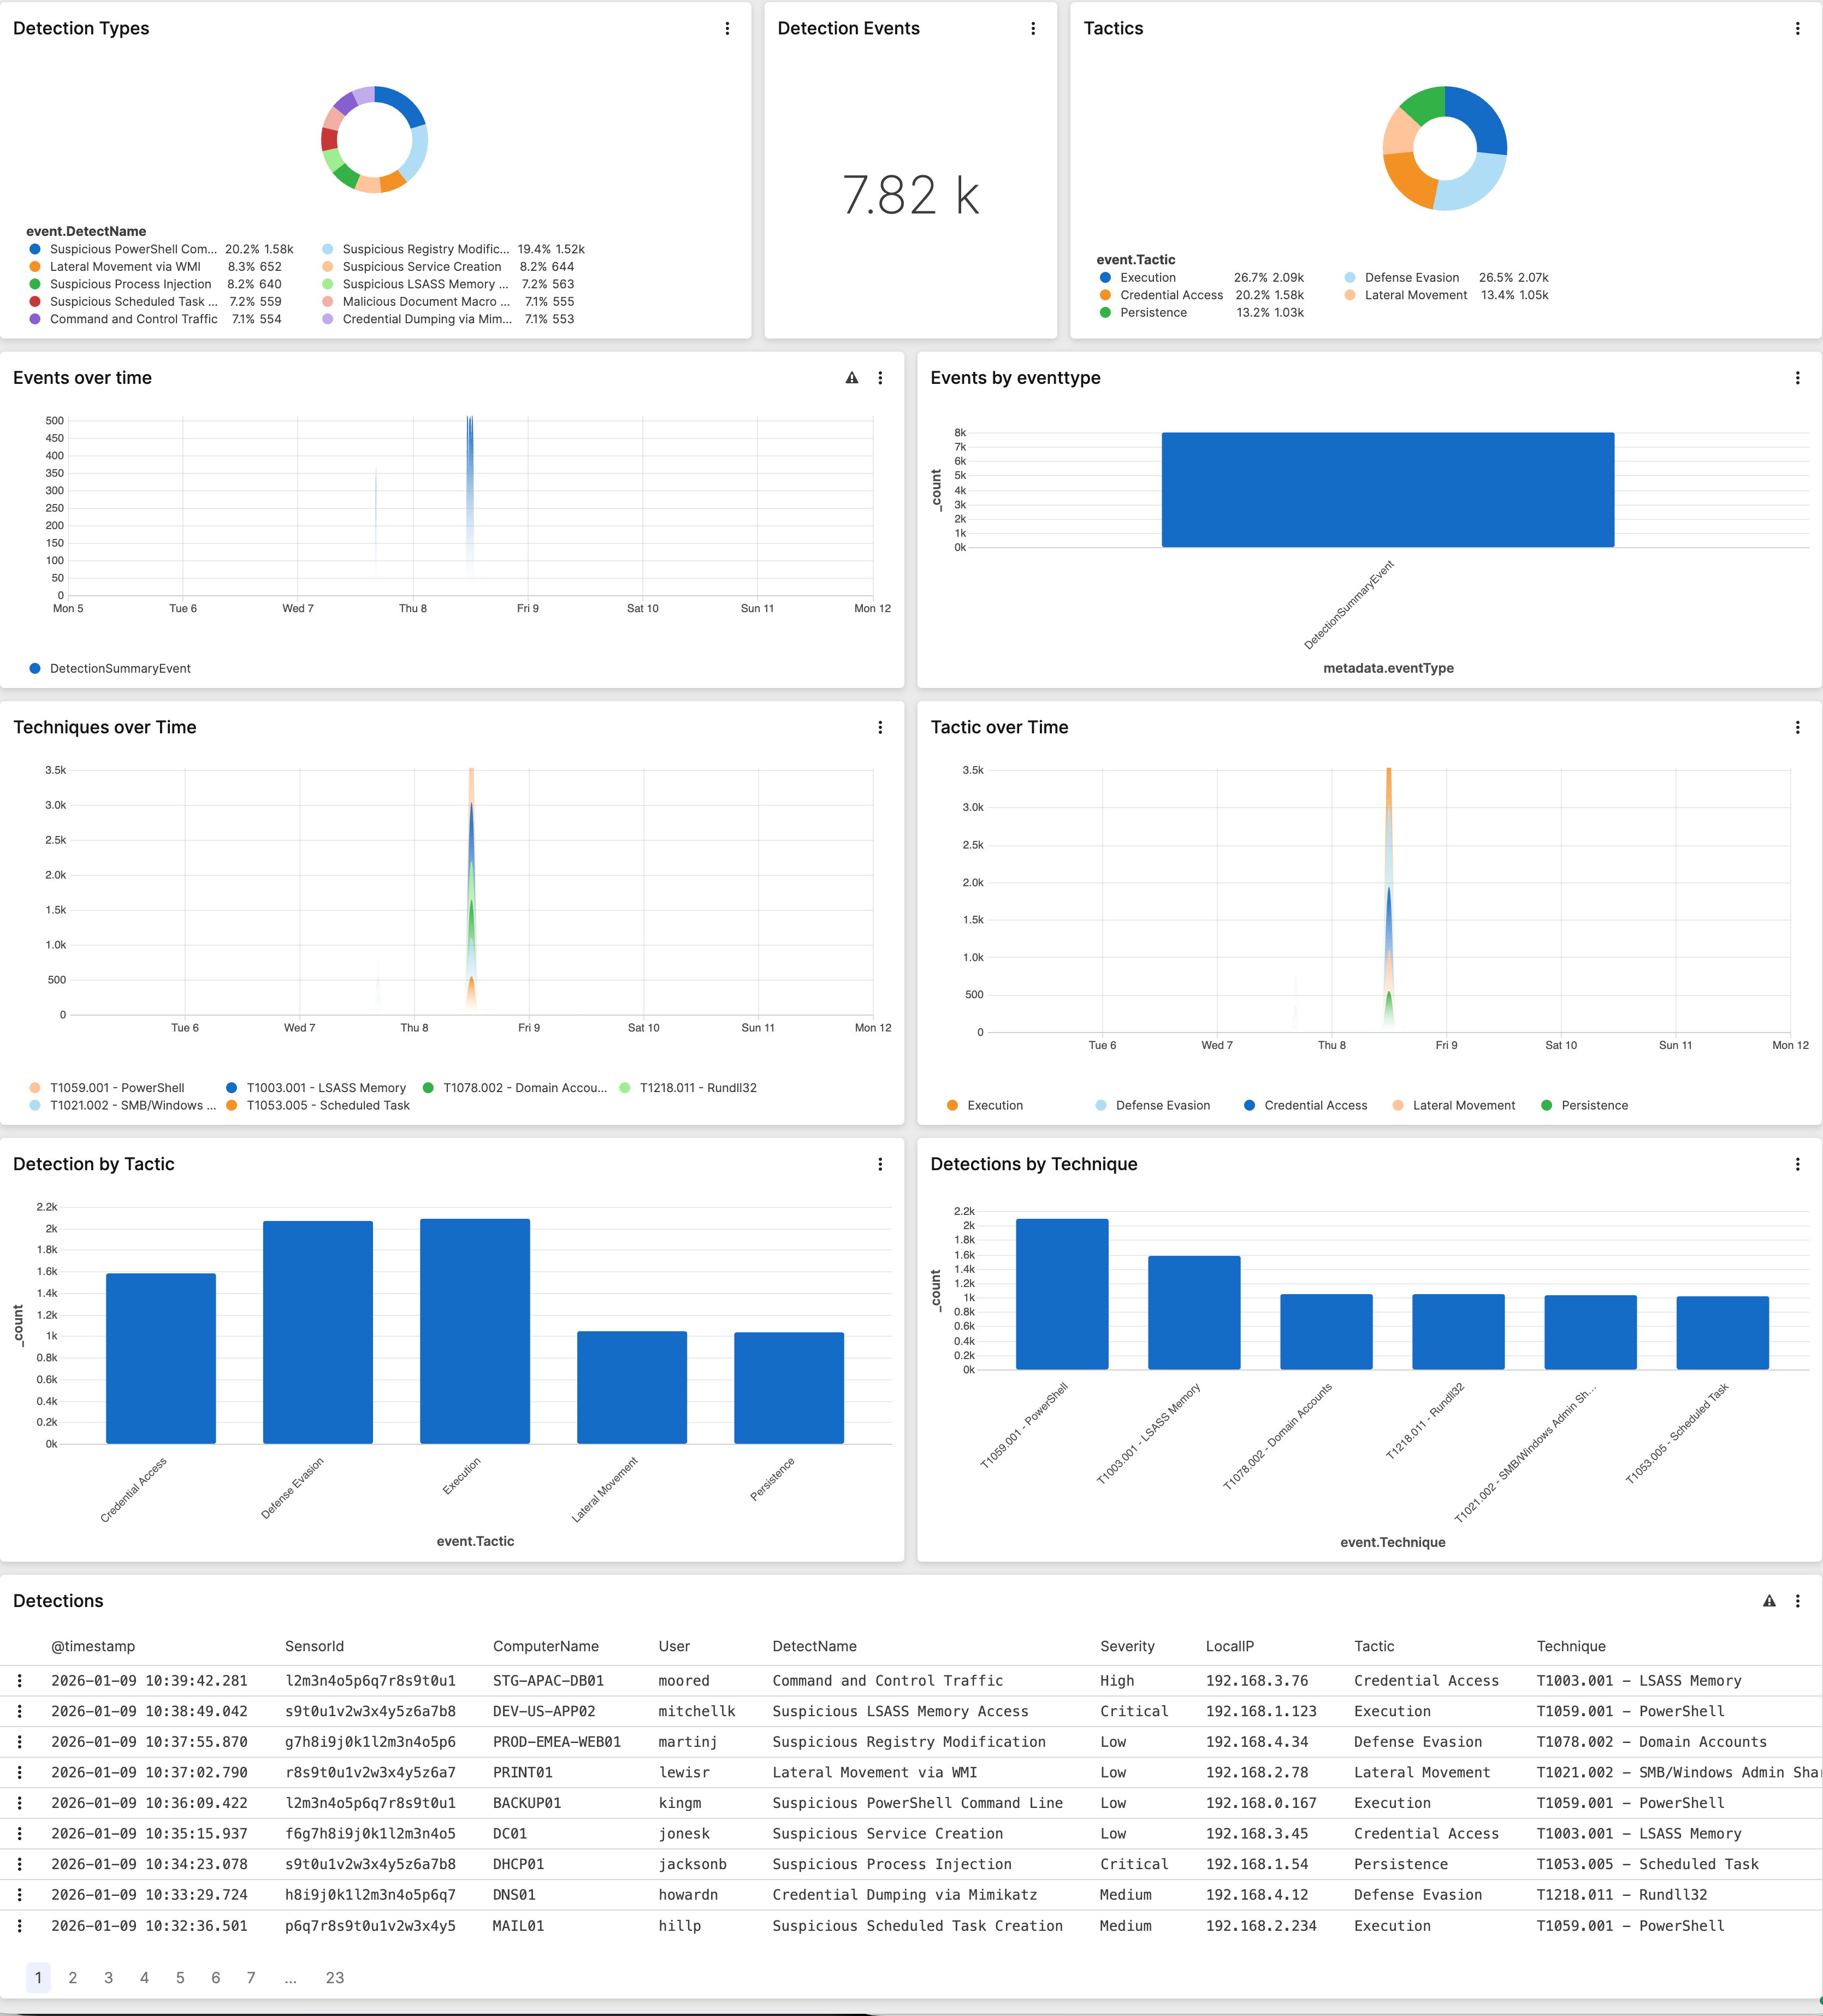
Detections
The Detections dashboard provides comprehensive visibility into security detections and alerts from CrowdStrike Falcon through a series of interconnected visualizations. This dashboard enables monitoring, analysis, and response to potential threats in the environment.
 |
| Widget | Description | Type |
|---|---|---|
Displays a pie chart of detection types.
| Pie Chart | |
Displays a table of event detections and associated data
(timestamp, sensor ID, ComputerName, User,Severity, Local IP,
etc.)
| Table | |
Displays a chart of detected event techniques over a 1 hour
timespan.
| Time Chart | |
Displays a summary of detection events by computer name and
customer IDS string.
| Gauge | |
Displays a chart of detections by technique.
| Bar Chart | |
Displays a chart of event detections by tactic.
| Bar Chart | |
Displays a chart of event tactics over a 1 hour timespan by
computer name and customer IDS string.
| Time Chart | |
Displays a pie chart of top event tactics.
| Pie Chart | |
Displays a chart of events by event type using metadata.
| Bar Chart | |
Displays a list of events over time
| Time Chart |
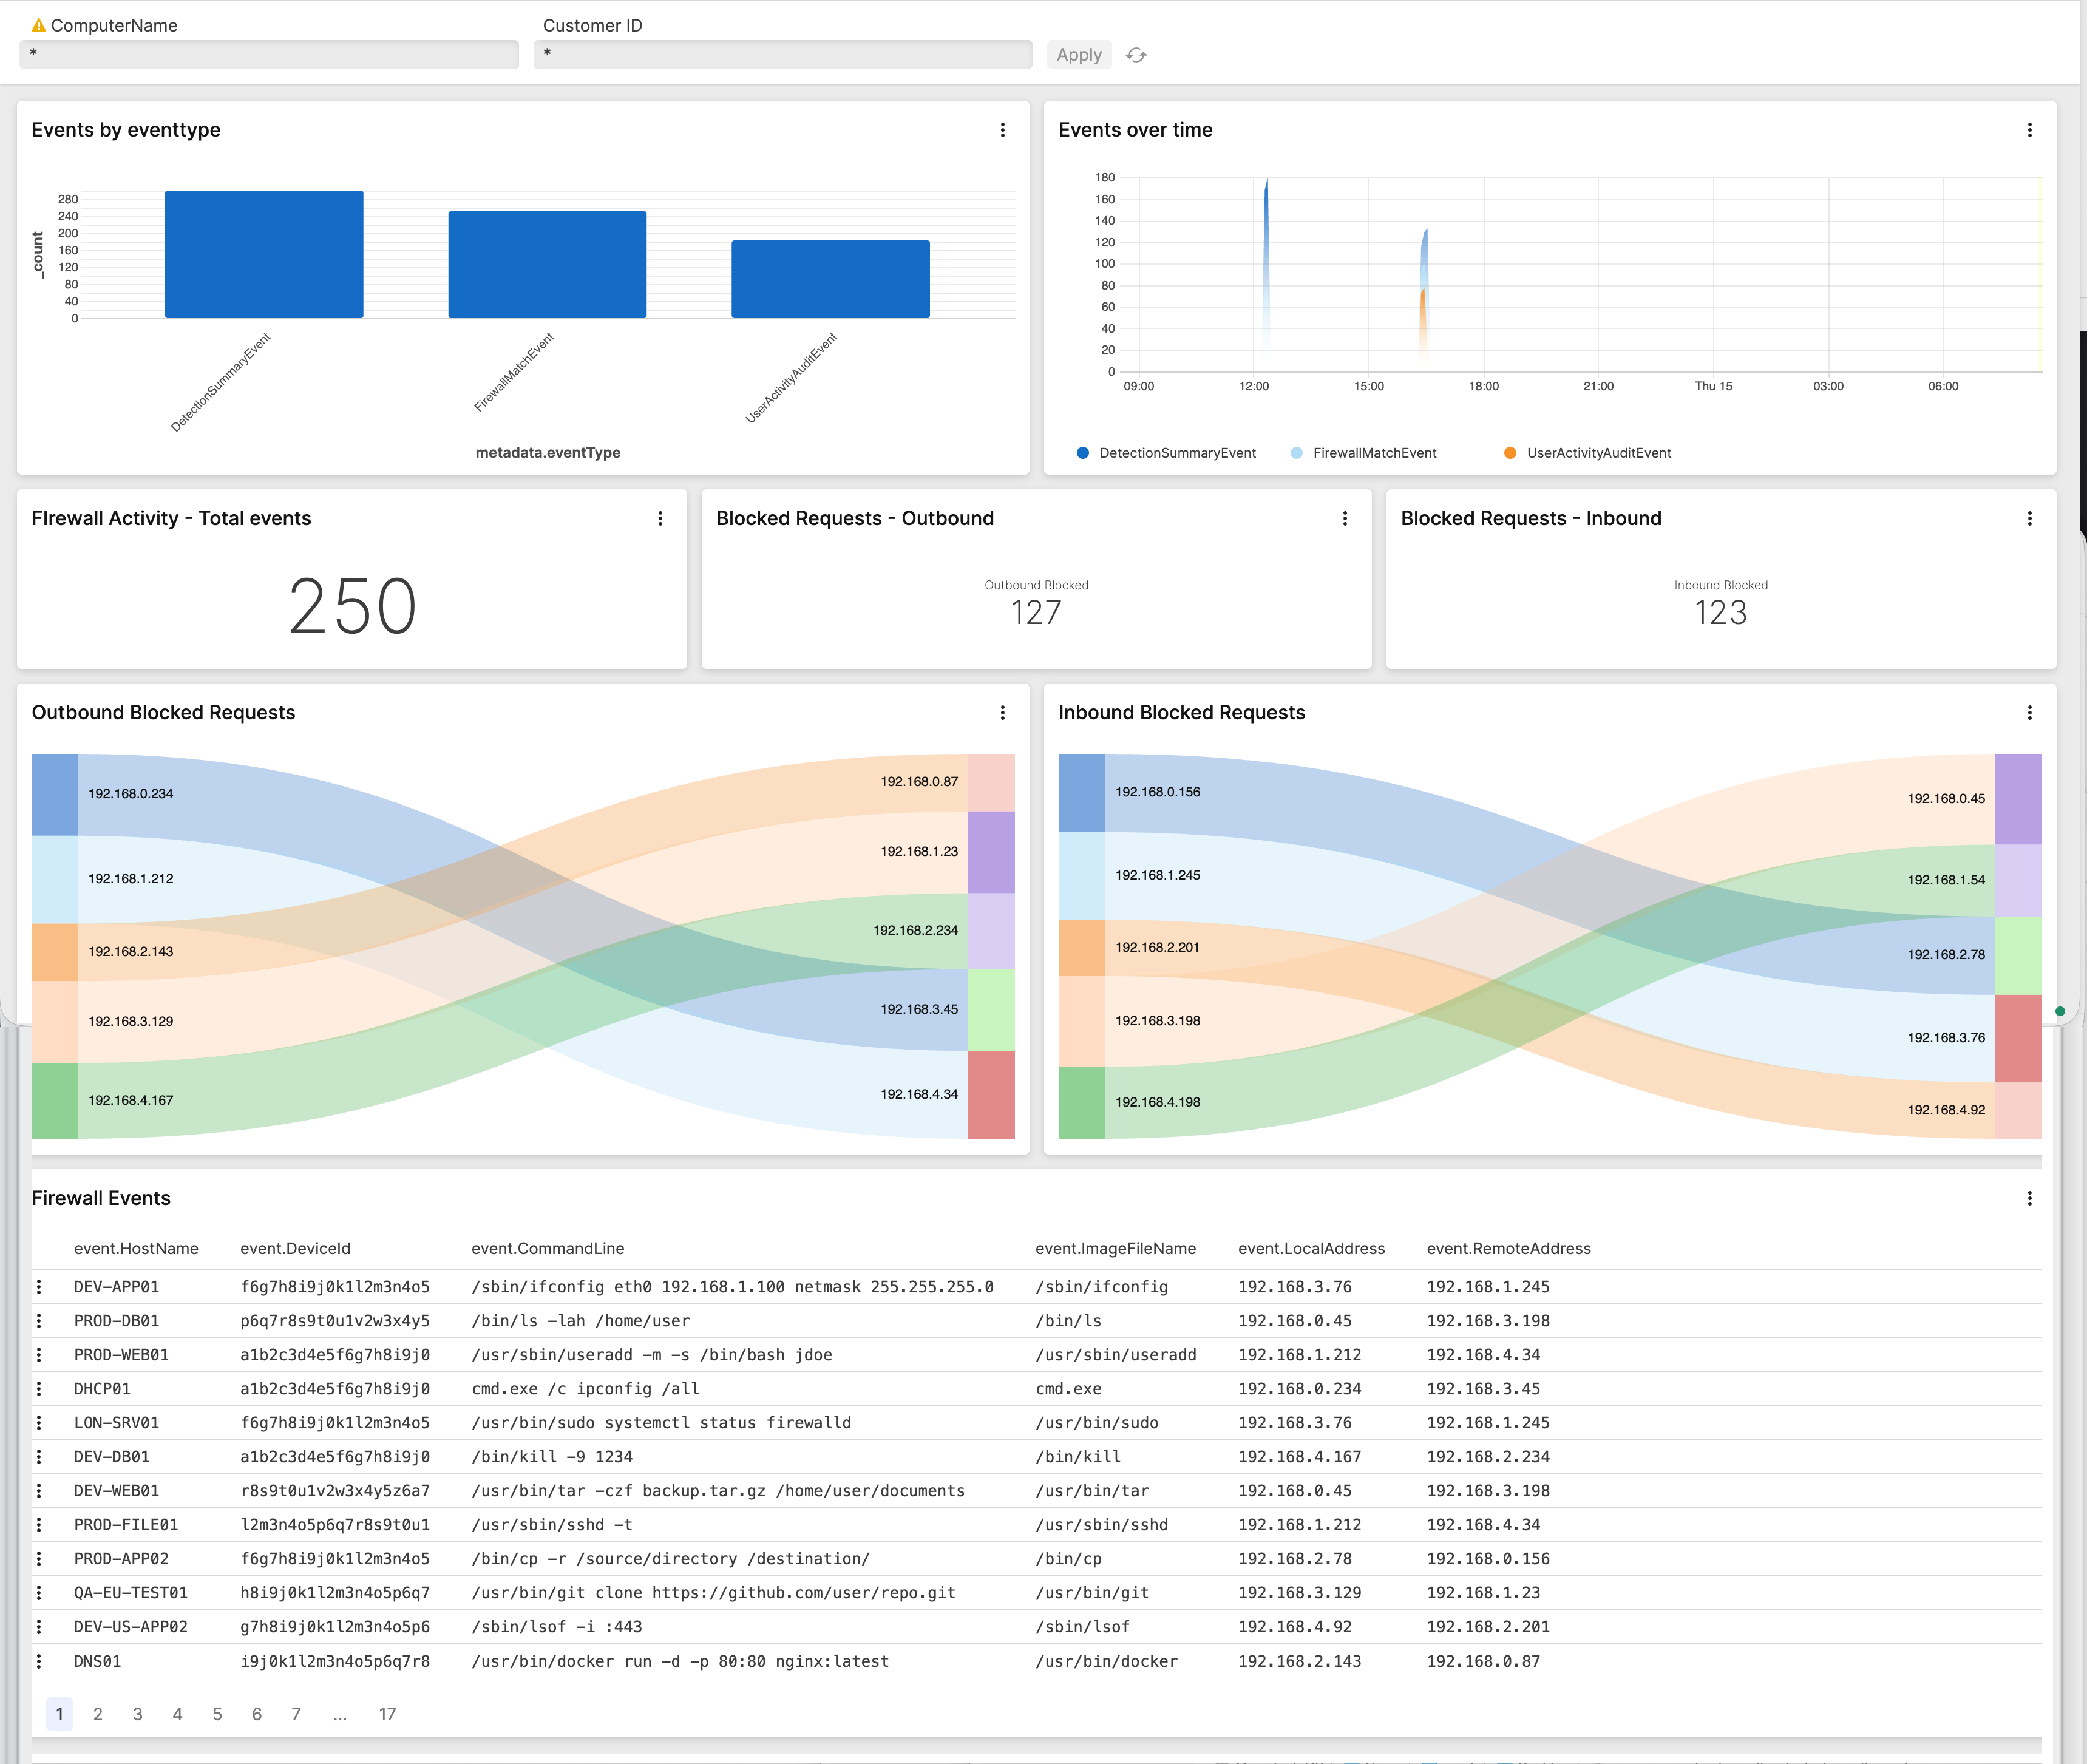
Firewall Activity
The Firewall Activity dashboard provides real-time visibility into network traffic patterns, security policy enforcement, and potential threats detected at the firewall level. This dashboard facilitates monitoring and analysis of network traffic behavior and security events across the environment.
 |
| Widget | Description | Type |
|---|---|---|
Displays a table of firewall events and associated data (host
name, device ID, event type, event policy name, etc.)
| Table | |
Displays a flowchart of outbound blocked requests using firewall
data from local address to remote address.
| Sankey | |
Displays a list of outbound blocked requests.
| Gauge | |
Displays a chart of events by event type using metadata.
| Bar Chart | |
Displays a list of blocked inbound access requests using metadata.
| Gauge | |
Displays a list of total firewall event activities.
| Gauge | |
Displays a list of events over time
| Time Chart | |
Displays a flowchart of inbound blocked requests from remote
address to local address.
| Sankey |
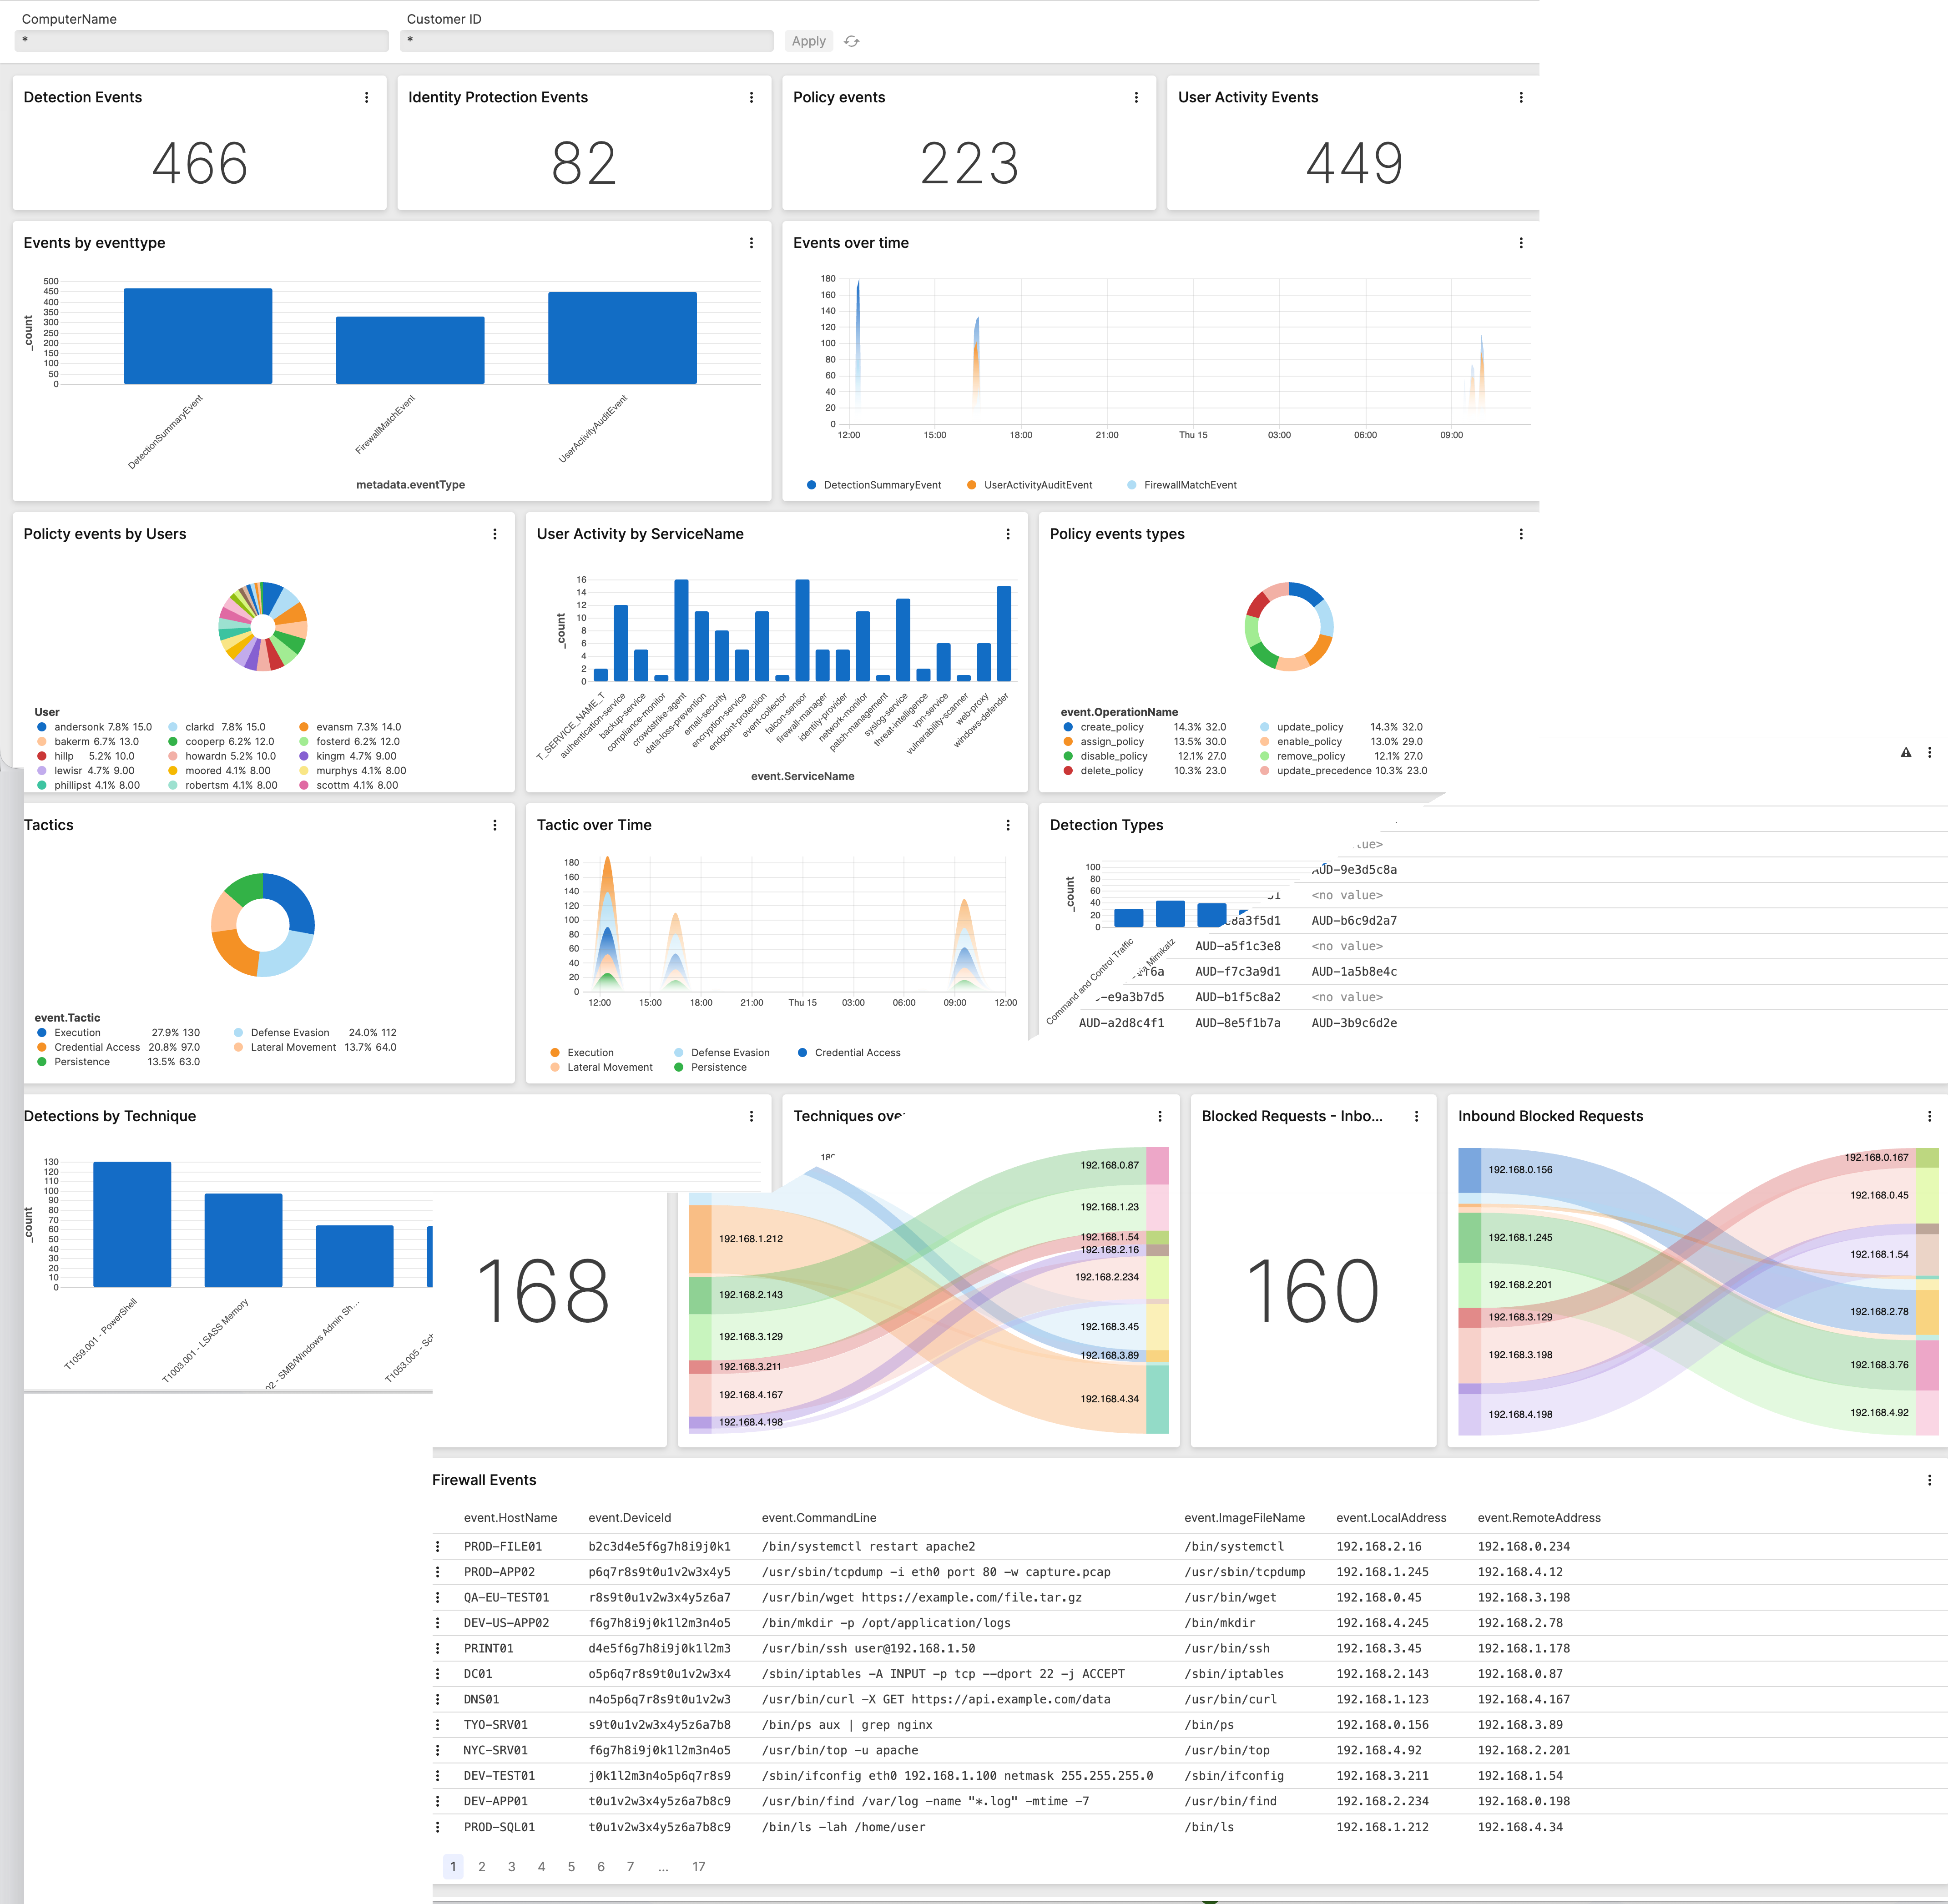
Summary Dashboard
The Summary dashboard serves as a high-level overview of security events, system health, and key metrics across the environment. This dashboard delivers a consolidated view of security posture and critical operational indicators.
 |
| Widget | Description | Type |
|---|---|---|
Displays a list policy events and associated data.
| Gauge | |
Displays a table of event detections and associated data
(timestamp, sensor ID, ComputerName, User,Severity, Local IP,
etc.)
| Table | |
Displays aggregated, policy-related events by user using metadata.
| Pie Chart | |
Displays a chart of detected event techniques over a 1 hour
timespan.
| Time Chart | |
Displays a summary of detection events by computer name and
customer IDS string.
| Gauge | |
Displays a table of firewall events and associated data (host
name, device ID, event type, event policy name, etc.)
| Table | |
Displays a flowchart of outbound blocked requests using firewall
data from local address to remote address.
| Sankey | |
Displays a list of outbound blocked requests.
| Gauge | |
Displays a chart of detections by technique.
| Bar Chart | |
Displays a chart of event detections by tactic.
| Bar Chart | |
Displays a chart of event tactics over a 1 hour timespan by
computer name and customer IDS string.
| Time Chart | |
Displays a chart of user activity by username.
| Bar Chart | |
Displays a pie chart of policy events by type using audit data.
| Pie Chart | |
Displays a pie chart of top event tactics.
| Pie Chart | |
Displays a chart of events by event type using metadata.
| Bar Chart | |
Displays user activity events using customer IDS string.
| Gauge | |
Displays a table of user activity events and associated data
(customer ID, user ID, service, operation).
| Table | |
Displays a list of blocked inbound access requests using metadata.
| Gauge | |
Displays a list of identity protection events.
| Gauge | |
Displays a list of events over time
| Time Chart | |
Displays a flowchart of inbound blocked requests from remote
address to local address.
| Sankey |
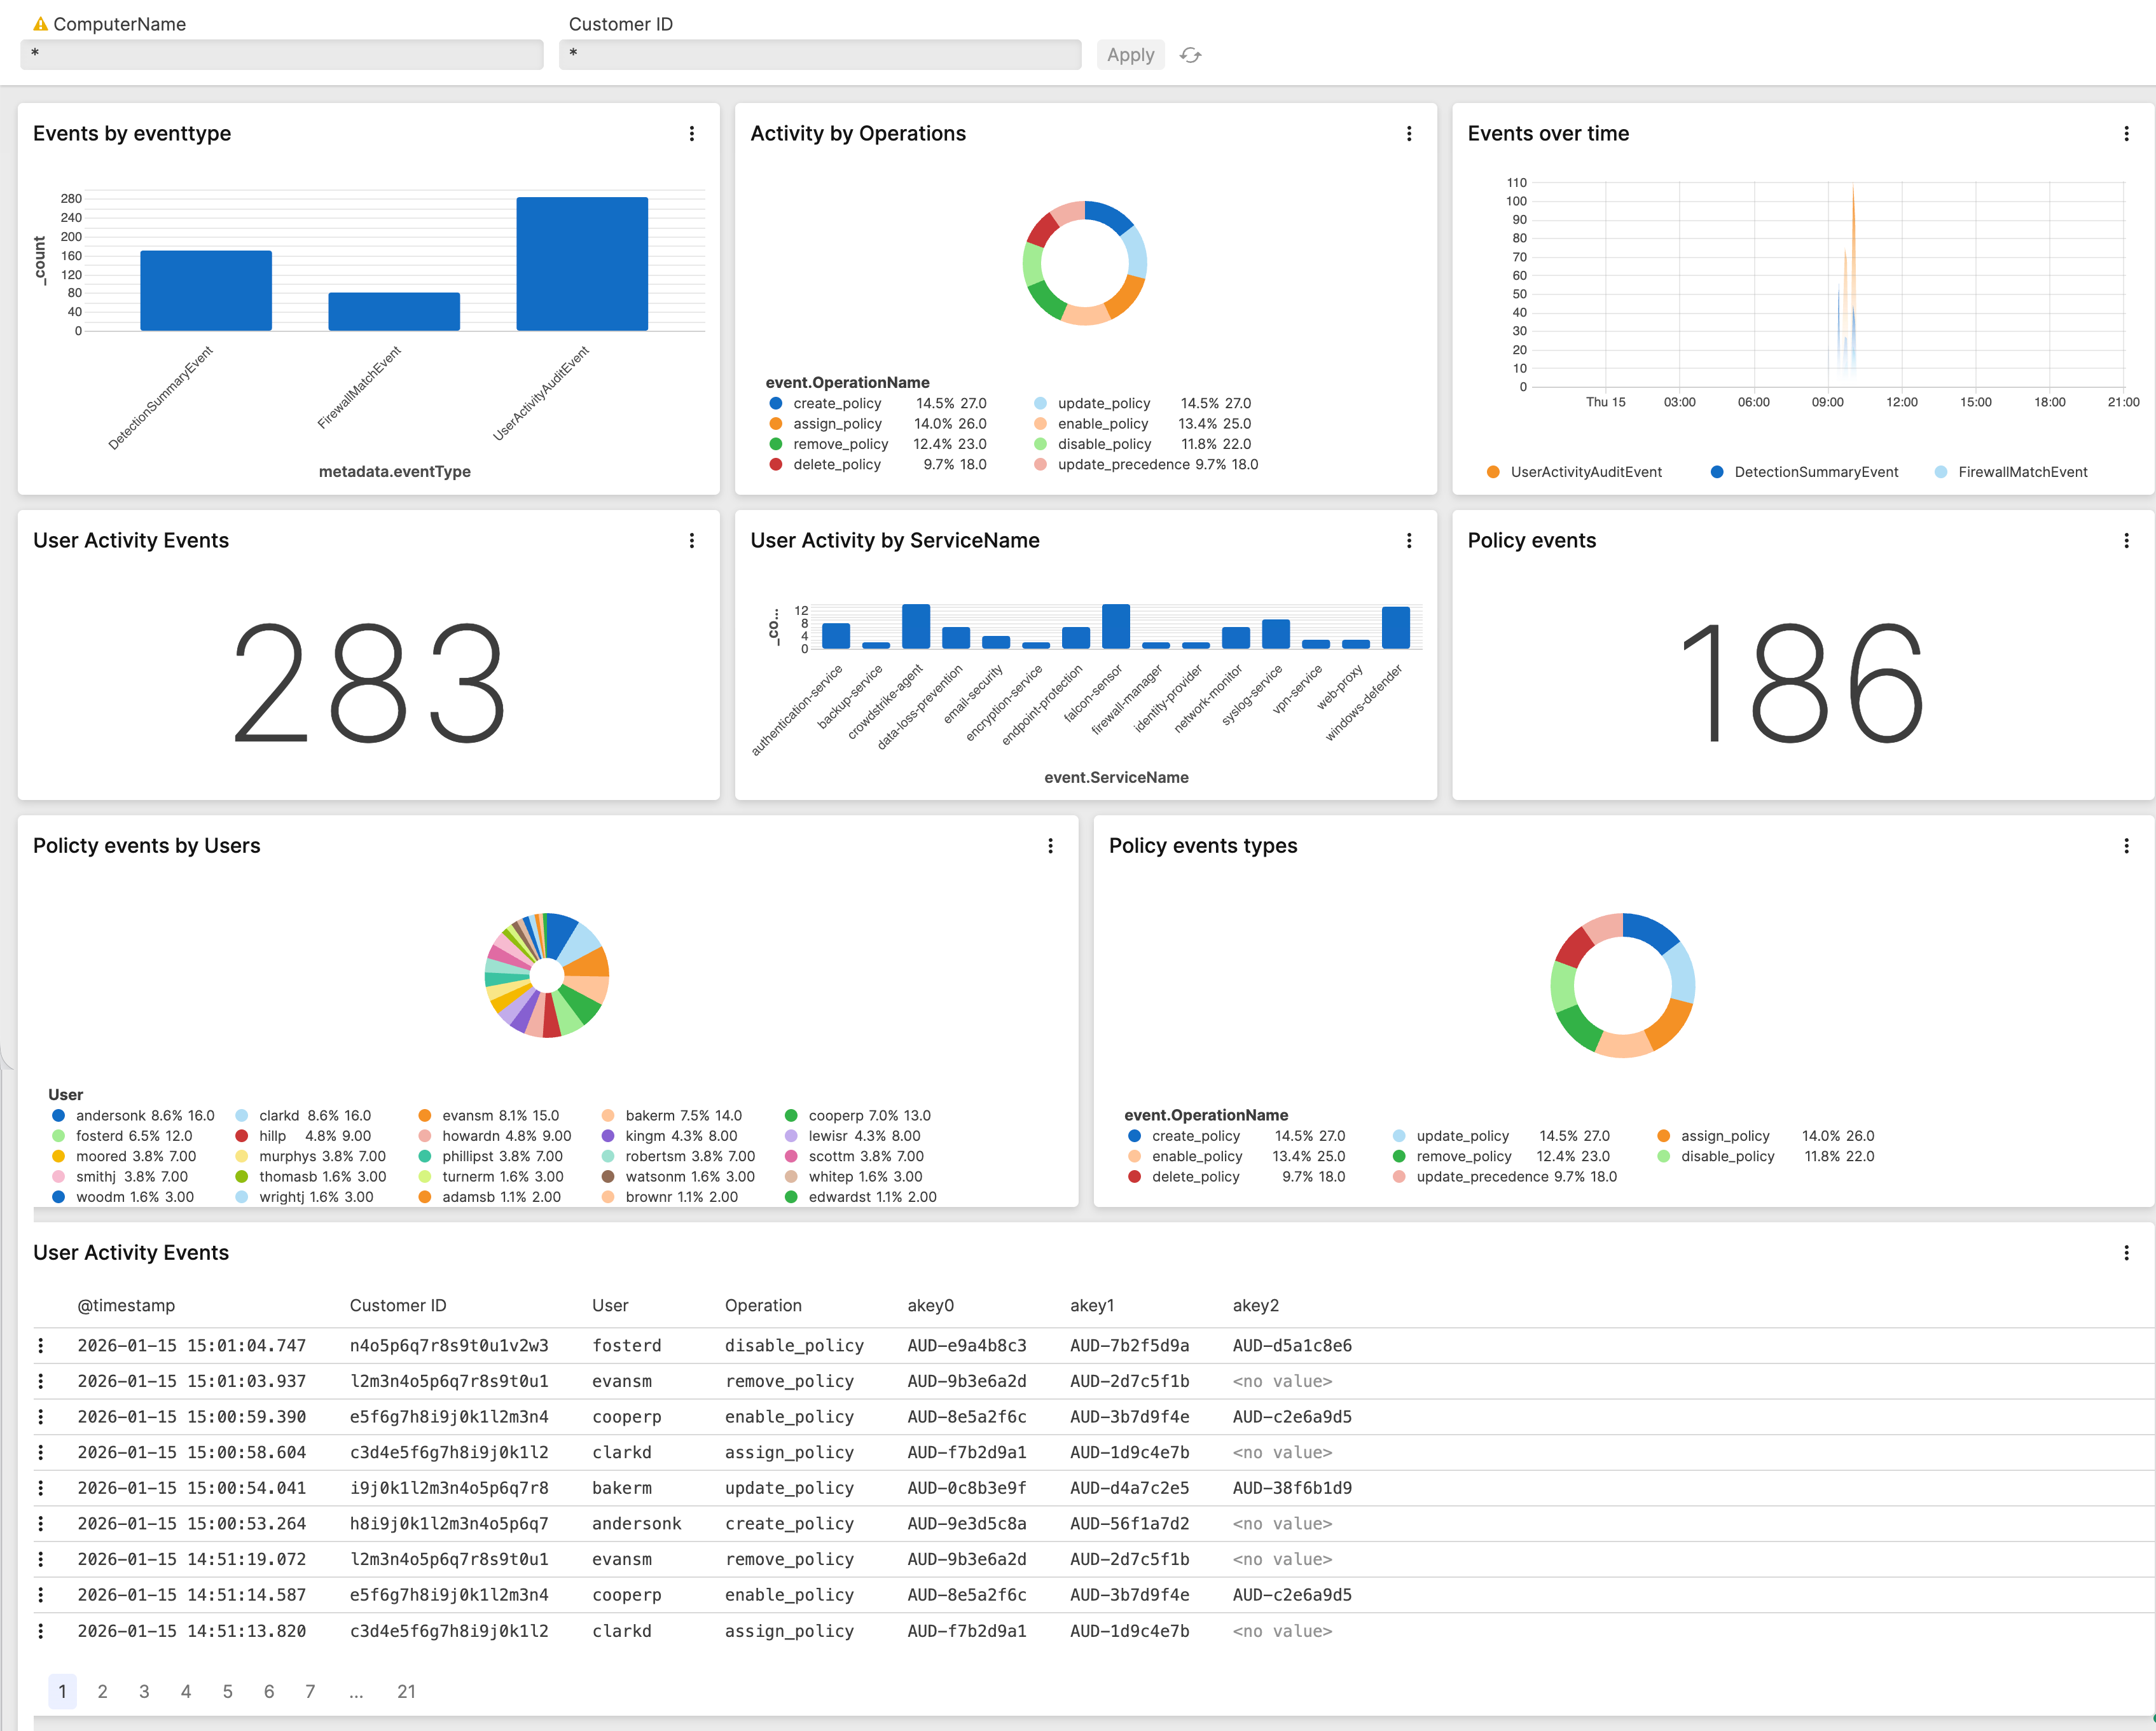
User Activity
The User Activity dashboard provides comprehensive visibility into user behavior, authentication events, and account-related activities across the environment. This dashboard facilitates monitoring of user actions, detection of suspicious behavior patterns, and tracking of authentication anomalies.
 |
| Widget | Description | Type |
|---|---|---|
Displays a list policy events and associated data.
| Gauge | |
Displays aggregated, policy-related events by user using metadata.
| Pie Chart | |
Displays a chart of user activity by username.
| Bar Chart | |
Displays a pie chart of policy events by type using audit data.
| Pie Chart | |
Displays a chart of events by event type using metadata.
| Bar Chart | |
Displays a pie chart of user activity by operation name.
| Pie Chart | |
Displays user activity events using customer IDS string.
| Gauge | |
Displays a table of user activity events and associated data
(customer ID, user ID, service, operation).
| Table | |
Displays a list of events over time
| Time Chart |