

corelight/threathuntingguide
| Vendor | Corelight, Inc. | Parsers | ✓ |
| Author | corelight | Dashboards | ✗ |
| Version | 0.3.0 | Alerts | ✓ |
| Minimum LogScale Version | 1.29.0 | Actions | ✗ |
| Scheduled Searches | ✗ |
Corelight network sensors are available as software or appliances. They use a specialized version of the open-source Zeek (formerly known as Bro) framework to provide detailed insights into what is happening in your network. This rich source of data covers over thirty-five different protocols and hundreds of different log fields, making it a valuable resource for security operation teams — including Threat Hunters.
Corelight threat hunting guide package contains alerts and saved searches that use Zeek (formerly known as Bro) data from Corelight network sensors. The package contains around 60 different alerts/searches that are useful when threat hunting within Corelight data to detect potentially suspicious activity.
The guide provides an excellent introduction to threat hunting with Corelight data. Corelight provides a rich source of logs for threat hunters and is capable of detecting a large range of attacker tactics and techniques. When threat hunters are reading the Corelight guide they can search the Humio alerts based on tactic and technique names or numbers to find the relevant Humio searches/alerts and simply click to run those searches.
Configure Ingestion to LogScale
Configuring a Corelight sensor to send data to LogScale is effortless and quick. Once you have network traffic coming in through the monitoring port of the Corelight sensor, there are only a few things you need to do.
First, you'll need to create a repository in LogScale just for Corelight. Then you'll have to configure Corelight to send data to LogScale.
Preparations in LogScale
You'll need to create a new repository in LogScale to hold the Corelight data. If you're not sure how to do this, see the Create a Repository documentation page.
Once you've created a repository, from that target repository in the LogScale Interface, select the Settings tab and then Packages on the left. From there, choose Marketplace and install the LogScale Package for Corelight (i.e. corelight/sensor), as shown in the screenshot in Figure 12, “Preparations in LogScale”.
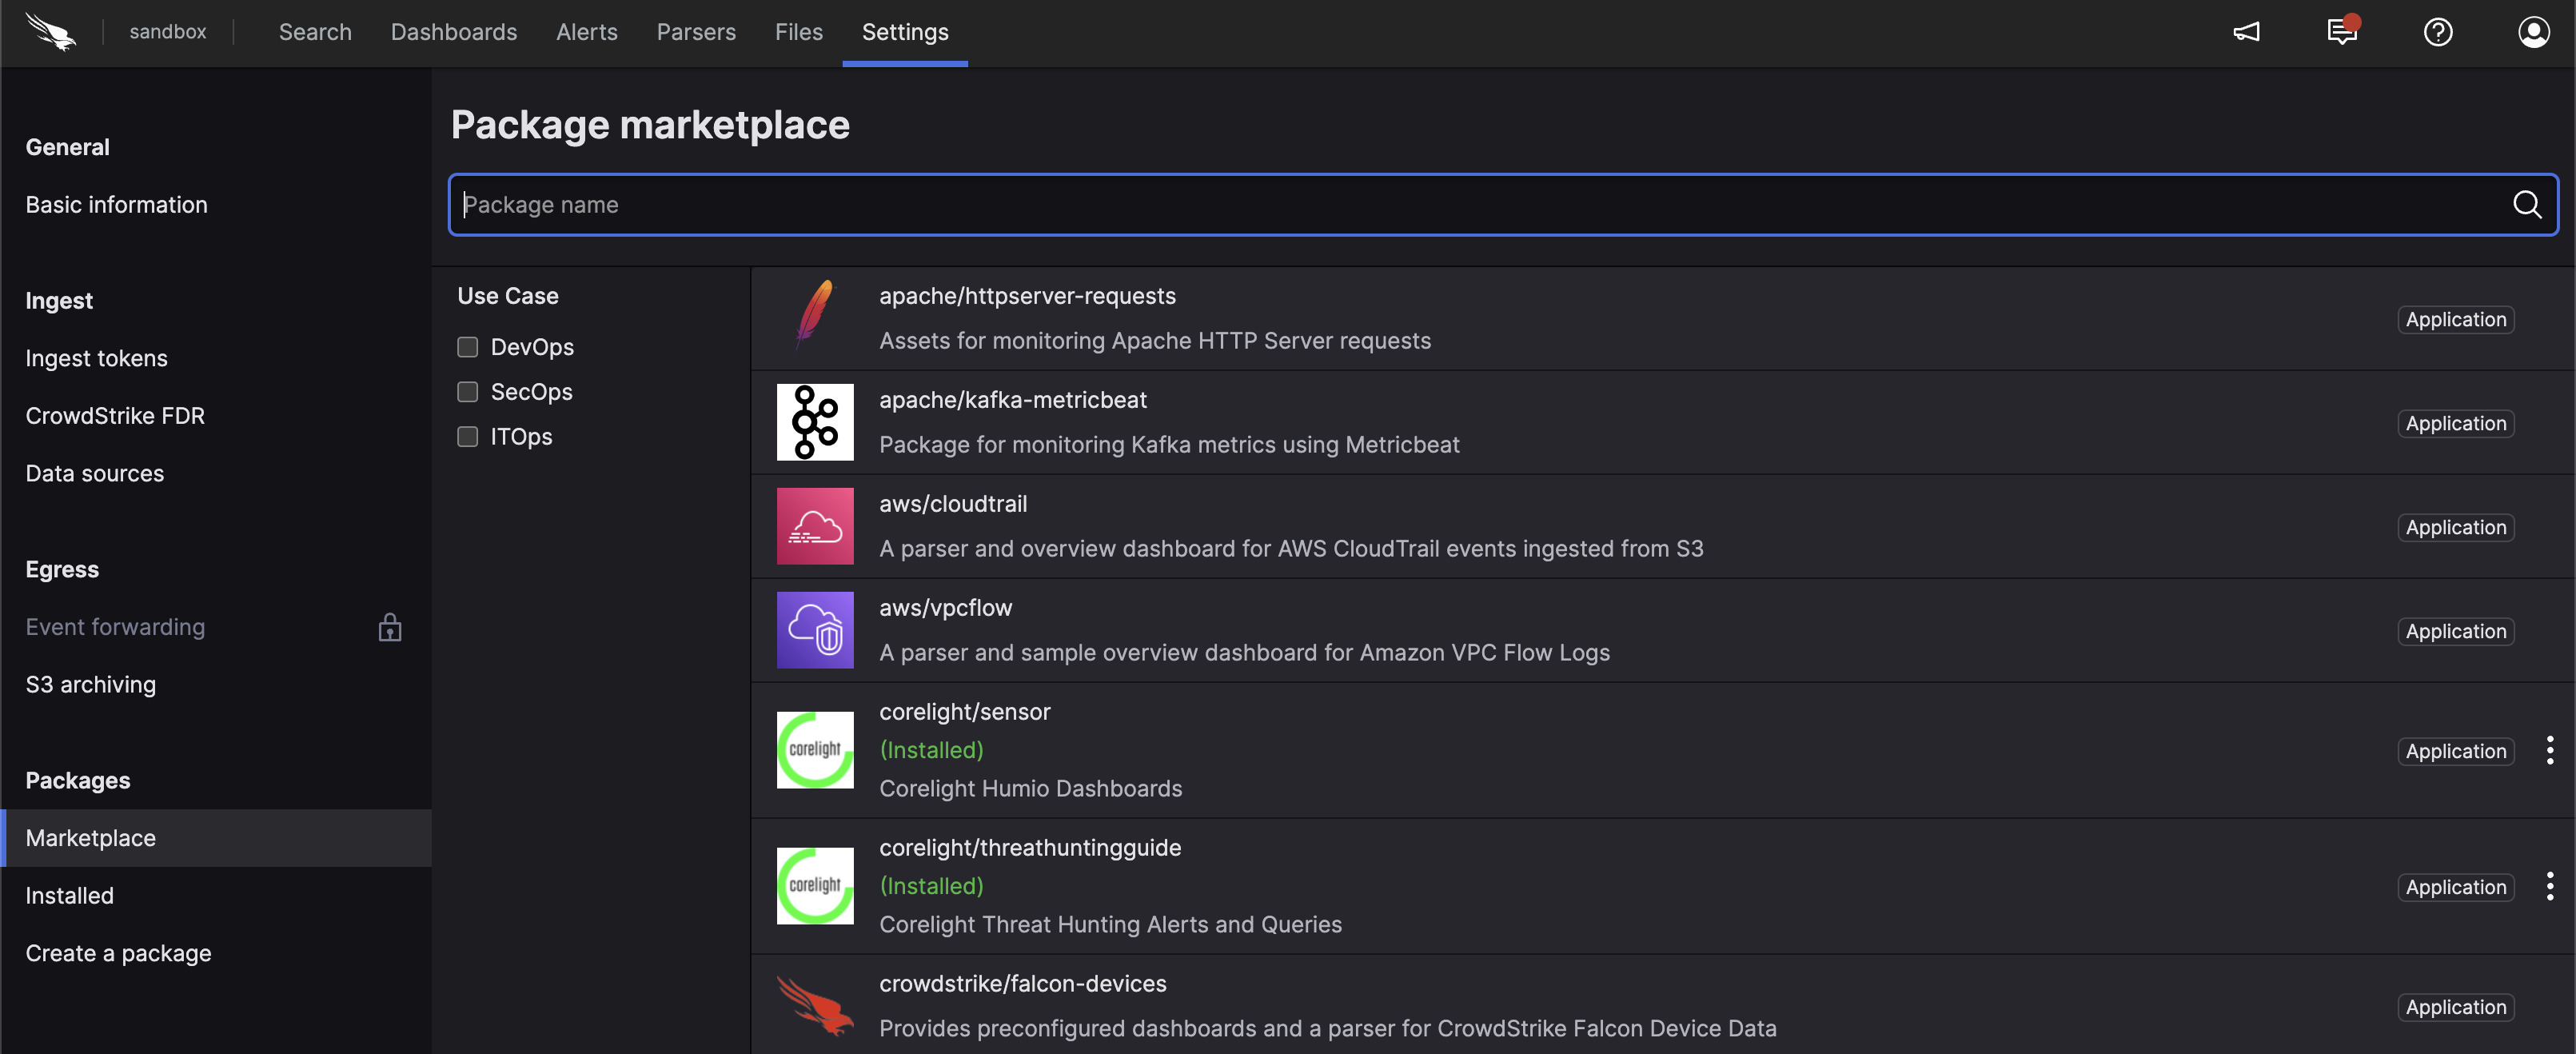 |
Figure 12. Preparations in LogScale
When you select the Corelight package, it will describe what the package provides and other related information. Of most interest is that it will install the required corelight parser. And it will install some overview dashboards that you can edit later to suit your needs.
When it's finished installing, from the Corelight
repository, go to the
Settings tab. In the
Ingest
section, click on the left (see
Figure 13, “Corelight Ingest Tokens”).
In the right panel, click to create a new token. Be sure to assign it the corelight parser. You can see the results of doing this in Figure 13, “Corelight Ingest Tokens”.
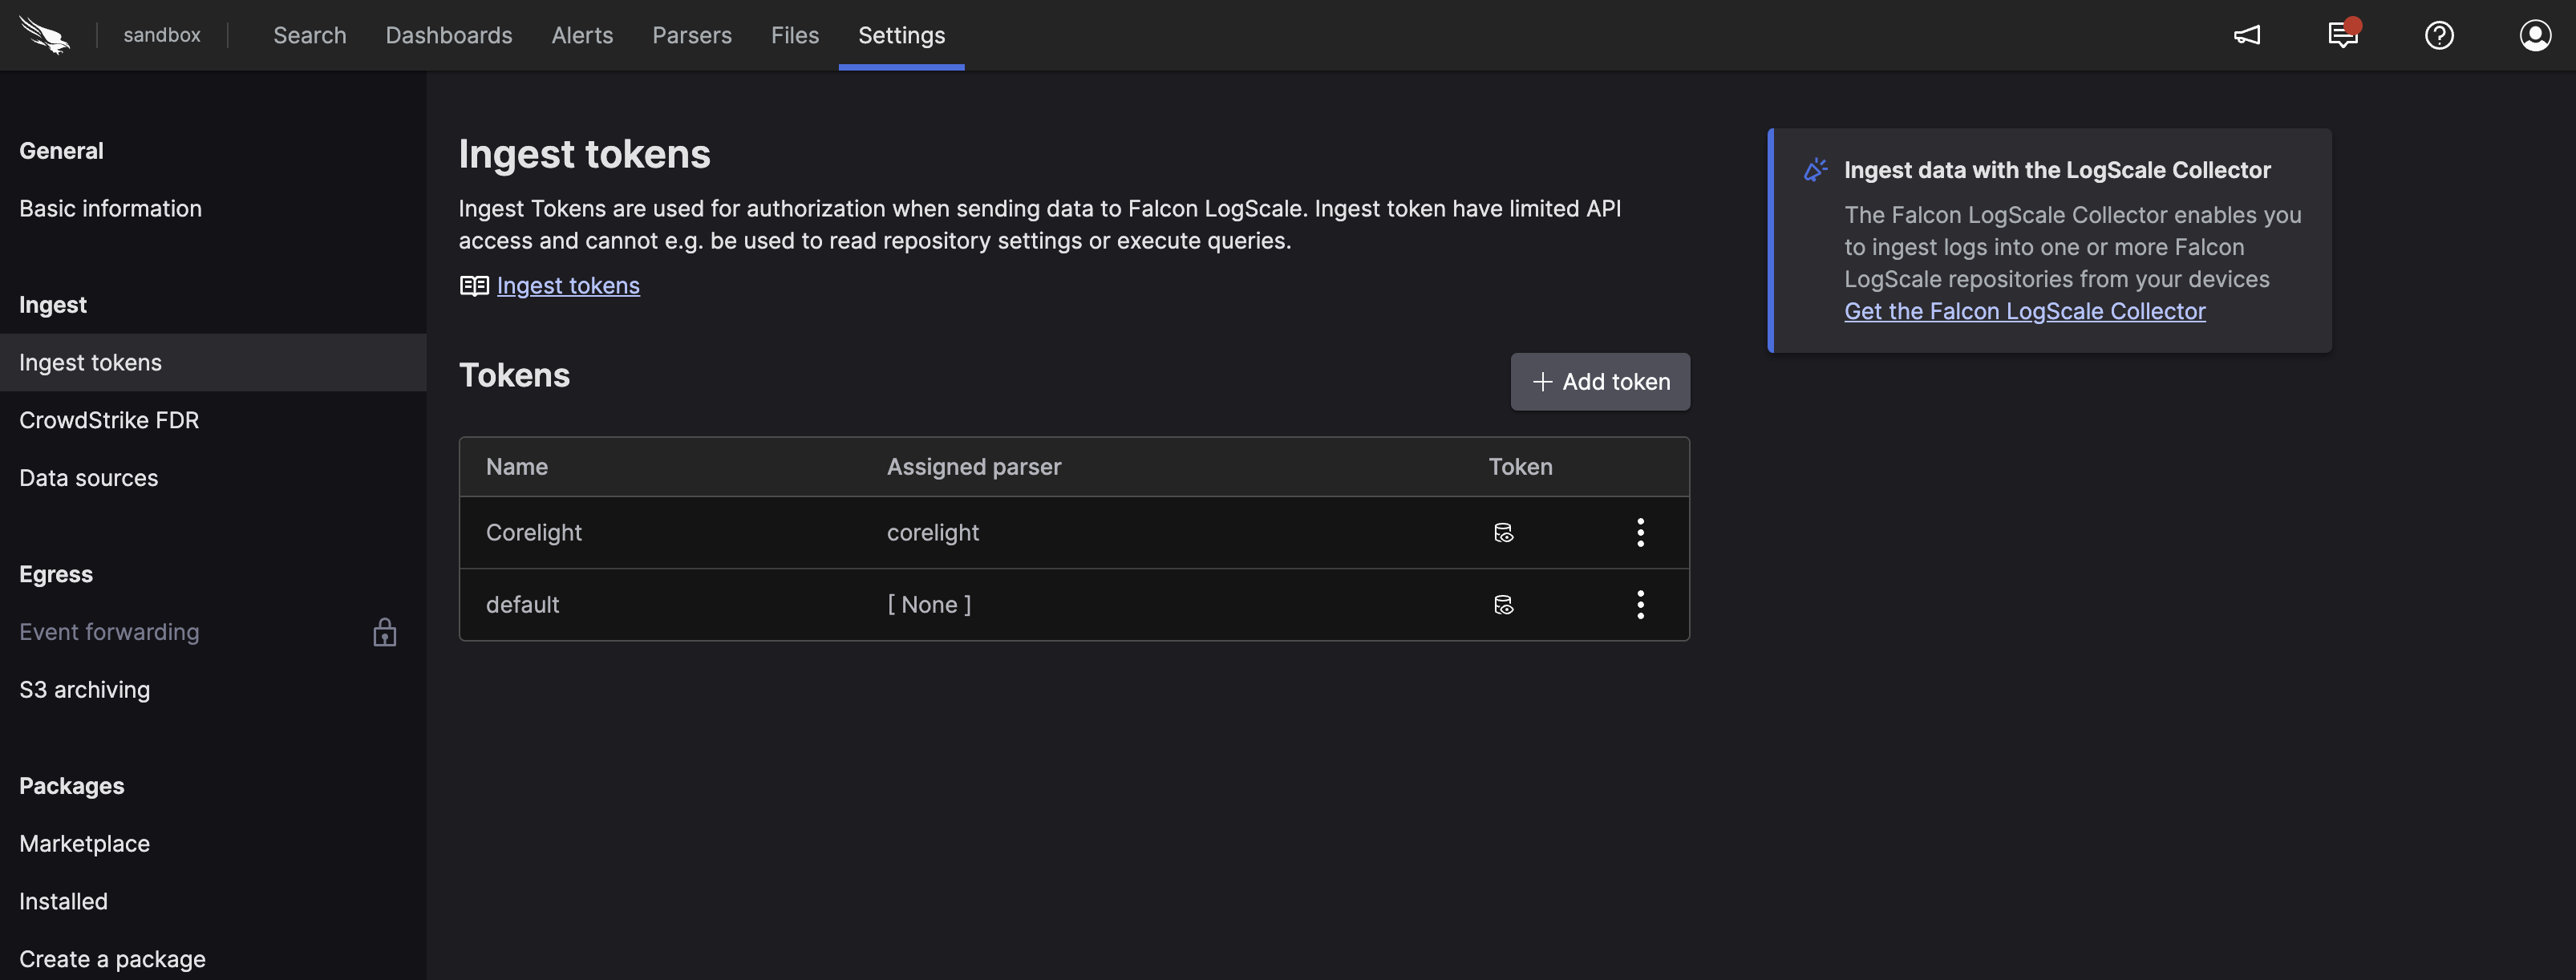 |
Figure 13. Corelight Ingest Tokens
Before leaving this page, view the Corelight token and copy it to your clipboard — or to save it temporarily elsewhere.
Now that you have a repository set up in LogScale to receive data from Corelight, you're ready to configure Corelight.
Configure Corelight
To configure Corelight to send data to LogScale, to the repository created in the previous section, you'll have to log into the Corelight management interface. Navigate to the Sensor menu and choose Export. From there, select Export to Splunk HEC. Despite the label, this is the preferred option for sending logs from Corelight to LogScale.
You'll be presented with a screen asking for several setting values similar to the screenshot shown below in Figure 14, “Configure Corelight”.
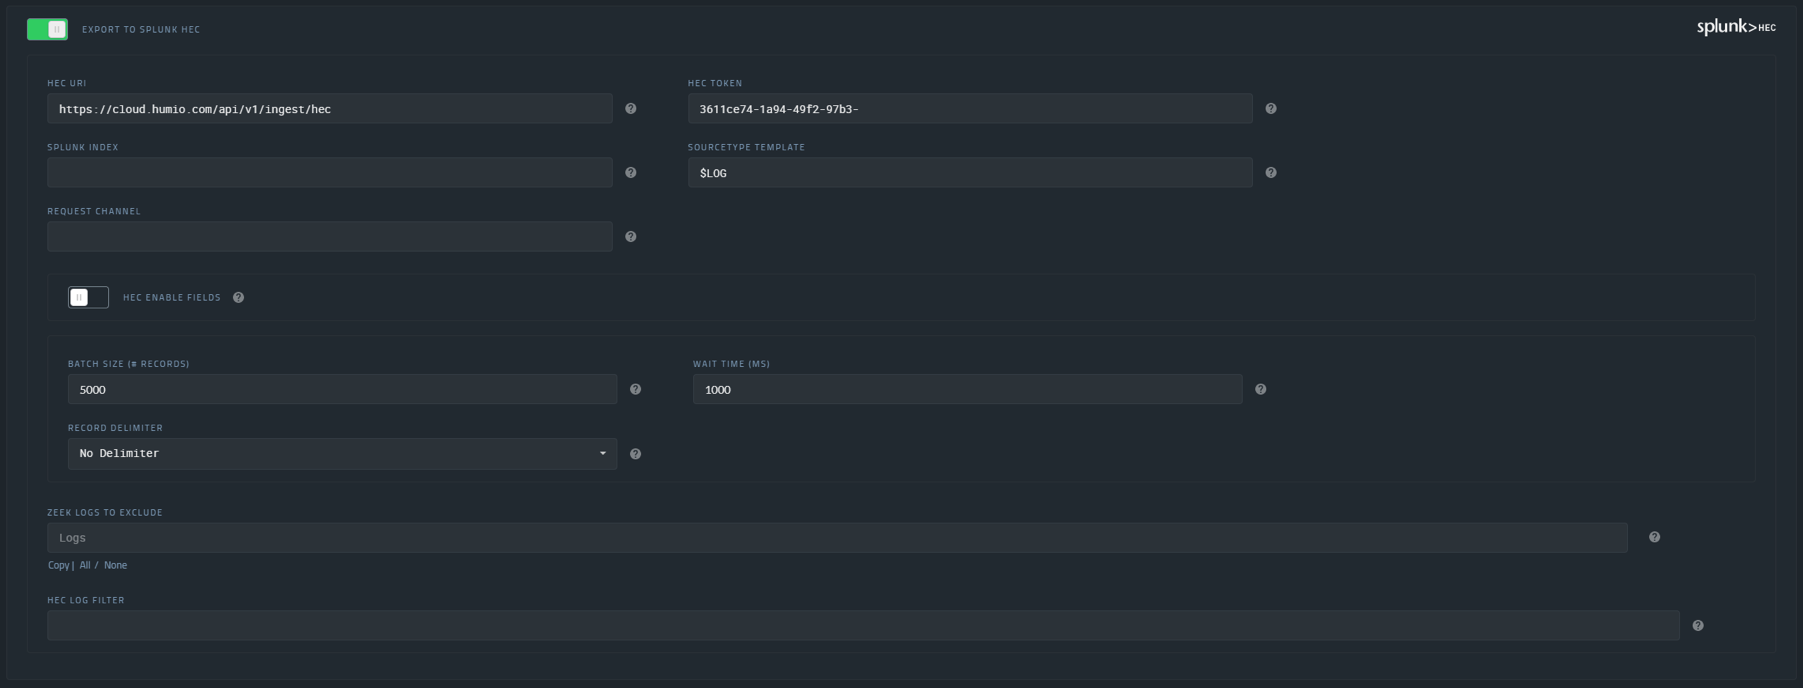 |
Figure 14. Configure Corelight
For the first box, the HEC URL, enter your LogScale service
URL appended with /api/v1/ingest/hec. For
example, if you're using the LogScale EU Cloud, you would
enter,
https://cloud.humio.com/api/v1/ingest/hec.
In the box labeled, HEC Token, paste in the ingest token you
copied earlier from the target repository above (see
Figure 13, “Corelight Ingest Tokens”).
Then set the Sourcetype Template to
$LOG, as shown in the
screenshot above.
For the rest of the settings you can probably accept the defaults, initially. However, you may want to check those settings to ensure all of the logs you need are being sent to LogScale — and that you're excluding what you don't want to send.
After a bit, the Corelight logs should be ingested into your LogScale repository. Navigate to the LogScale repository and view the Corelight dashboards to check data is coming in and is displayed as expected.
More Information
Corelight and LogScale's integrated solution helps customers manage security threats and gain visibility across an organization's entire network. LogScale and Corelight have a long established partnership. The LogScale service is used for the Corelight@home program, which provides an easy way to use Corelight with a Raspberry Pi based software sensor.
For Corelight customers wishing to use LogScale purely for their Corelight data, we have a unique pricing offer that provides unlimited ingest. Pricing is based on the size of Corelight sensor.
For more information on using Corelight with LogScale, review these resources:
Installing Corelight Packages
To install the Corelight packages:
Go to the humio-organization-corelight-demo view.
Click on the button
Go to the Marketplace under the tab in your view.
Choose the
corelight/sensorpackage from the package summary.Click the button.
Repeat the process with the corelight/threathuntingguide package.
To start querying the data, see Sample Queries.
Data Format
The sample data is derived from Corelight installation dataset, parsed and presented within the Corelight repository. The data has been extracted from a running Corelight capture service and includes an array of different information, triggers, and threats from the captured data.
The repository content consists of 74 minutes data, replayed on a loop so that the information is active within the repository. Although the data is repeated, the format and structure of the information provides an ideal resource for running and executing queries to understand the format and output.
Common Event Data
Event data has been parsed and tagged from raw JSON presented by Corelight. Event data contains the following core information for each event:
Source and Destination IP address and Port
Top-level Protocol (UDP or TCP)
Service-level Protocol (dns, ssl, http)
Bytes sent and received
Hardware address for source and destination
Timestamps for the packet and when it was recorded
Duration of the connection
Protocol specific data
Corelight recognises a number of distinct types of data where additionals fields and information are identified and included. The following are examples only:
For DNS the requested query type (for example address, server, MX (mail) record)
For HTTP, if identifiable, the source and content of the data
For DHCP, lease, IP address, MAC address and whether a specific name or ID is used
For file transfer, the file size, name, and digest contents
Alerts or triggers identified by Corelight thread detection:
Alert level
Category, including a description
The raw data from Corelight is presented as JSON, for example:
{
  "_path": "conn",
  "_system_name": "SmartPCAP_192_168_5_1",
  "_write_ts": "2022-02-18T16:07:48.737324Z",
  "community_id": "1:WOlQiyEP/B3qO3ib+RwAYV06Av8=",
  "conn_state": "S0",
  "corelight_shunted": false,
  "duration": 0.00754499435424805,
  "history": "S",
  "id.orig_h": "10.9.18.101",
  "id.orig_p": 49218,
  "id.resp_h": "66.96.147.100",
  "id.resp_p": 587,
  "local_orig": true,
  "local_resp": false,
  "missed_bytes": 0,
  "orig_bytes": 0,
  "orig_ip_bytes": 152,
  "orig_l2_addr": "00:08:02:1c:47:ae",
  "orig_pkts": 3,
  "proto": "tcp",
  "resp_bytes": 0,
  "resp_cc": "US",
  "resp_ip_bytes": 0,
  "resp_l2_addr": "20:e5:2a:b6:93:f1",
  "resp_pkts": 0,
  "spcap.rule": 6,
  "spcap.trigger": "all-unencrypted",
  "spcap.url": "https://192.168.5.1/spcap/v1/?uid=CxZD5YDQVXFfwHSW7",
  "ts": "2022-02-18T16:07:43.737232Z",
  "uid": "CxZD5YDQVXFfwHSW7"
}
Within the sample repository data, the raw JSON has been parsed into a combination of tags and fields.
Common fields from the data parsed into the events within LogScale:
#pathPrimary event type, this indicates the main log event, for example HTTP, SSL, raw TCP. See Event Types (
#path).Unique ID for each event
uidA unique ID for the session, which may include multiple events. This can be used to identify a sequence of communication that may include multiple types of events. See Session Identifier (
uid).tsTimestamp for the event, to the nearest millisecond.
Event Types (#path)
The events consist of the following major event types
(identified through the event
#path tag):
conn
IP, TCP, UDP and ICMP connection details
dce_rpc
DCE/RPC communication information
dhcp
DHCP lease information
dns
DNS query and response details
files
File analysis results
notice
Notices of identified information generated by the Corelight device
smartpcap-stats
SmartPCAP statistics from th Corelight device
ssl
SSL handshakes
x509
X.509 certificate information
For more information on the specific fields within each event type, consult the Zeek log files reference.
To get a full list of all the available event types in the sample data you can use:
groupBy(#path)
| sort(_count)
This will produce the following list:
| #path | _count |
|---|---|
| conn | 626182 |
| dns | 309720 |
| files | 99111 |
| http | 65871 |
| ssl | 61076 |
| ntp | 25809 |
| dhcp | 25648 |
| notice | 20378 |
| smartpcap-stats | 19708 |
| x509 | 15073 |
| intel | 11615 |
| corelight_overall_capture_loss | 9855 |
| suricata_corelight | 9245 |
| weird | 4971 |
| dce_rpc | 2012 |
| specific_dns_tunnels | 1712 |
| smartpcap | 1007 |
| etc_viz | 811 |
| rdp | 679 |
| ssh | 410 |
| smb_mapping | 379 |
| kerberos | 367 |
| smtp | 286 |
| smtp_links | 268 |
| ntlm | 208 |
| smb_files | 184 |
| reporter | 177 |
| software | 163 |
| dpd | 113 |
| pe | 103 |
| snmp | 95 |
| ftp | 39 |
| meterpreter | 10 |
| meterpreter_headers | 10 |
| radius | 9 |
| stepping | 7 |
| dga | 6 |
| generic_icmp_tunnels | 2 |
| tunnel | 2 |
| log4j | 1 |
Session Identifier (uid)
The uid field
identifies events related to an individual session. The
duration of the session depends on the communication
involved. For example, a DNS query might consist of only two
events (the request and the response) or thousands of events
across a variety of different types.
You can see this by searching the
uid
CCsBUu3O2Z0QfCd6Y8:
uid = CCsBUu3O2Z0QfCd6Y8This returns just two events:
| AA | RA | RD | TC | TTLs | Z | _path | _system_name | _write_ts | answers | community_id | conn_state | corelight_shunted | duration | history | id.orig_h | id.orig_p | id.resp_h | id.resp_p | local_orig | local_resp | missed_bytes | orig_bytes | orig_ip_bytes | orig_l2_addr | orig_pkts | proto | qclass | qclass_name | qtype | qtype_name | query | rcode | rcode_name | rejected | resp_bytes | resp_ip_bytes | resp_l2_addr | resp_pkts | rtt | service | spcap.rule | spcap.trigger | spcap.url | trans_id | ts | uid |
|---|---|---|---|---|---|---|---|---|---|---|---|---|---|---|---|---|---|---|---|---|---|---|---|---|---|---|---|---|---|---|---|---|---|---|---|---|---|---|---|---|---|---|---|---|---|---|
| 0 | 1 | 1 | 0 | ARRAY(0x556f95c89908) | 0 | dns | SmartPCAP_192_168_5_1 | 2022-02-18T16:07:44.147273Z | ARRAY(0x556f95d1ef00) | 10.9.18.101 | 52060 | 10.9.18.1 | 53 | udp | 1 | C_INTERNET | 1 | A | mail.aepl.com.pk | 0 | NOERROR | 0 | 0.000414133071899414 | 39459 | 2022-02-18T16:07:44.146859Z | CCsBUu3O2Z0QfCd6Y8 | ||||||||||||||||||||
| conn | SmartPCAP_192_168_5_1 | 2022-02-18T16:07:54.147004Z | 1:xd/MFWG+2N7nVcDr5rAJjgE3Jaw= | SF | 0 | 0.000414133071899414 | Dd | 10.9.18.101 | 52060 | 10.9.18.1 | 53 | 1 | 1 | 0 | 34 | 62 | 00:08:02:1c:47:ae | 1 | udp | 50 | 78 | 20:e5:2a:b6:93:f1 | 1 | dns | 6 | all-unencrypted | https://192.168.5.1/spcap/v1/?uid=CCsBUu3O2Z0QfCd6Y8 | 2022-02-18T16:07:44.146859Z | CCsBUu3O2Z0QfCd6Y8 |
By comparison,
CTYqn61mJNPJsIVG96
returns over 15,000 events
Using the uid field
enables you to tie multiple streams of events together. When
diagnosing errors or attacks this can aid in collecting
identical items together.