
Monitoring Usage
Security Requirements and Controls
View usagepermission
Keeping an eye on how much data is flowing into your LogScale instance is useful to see whether you're within your license limits and to make sure that your ingestion pipeline is set up correctly and your internal users have on-boarded.
Usage Page
On the Usage page, you can track and
get an overview of your organization's usage, which includes ingest,
storage, scanned data, and, if applicable, user seats.
The Usage page is available to organization owners only, and it can be
found under Organization Settings
→ Usage.
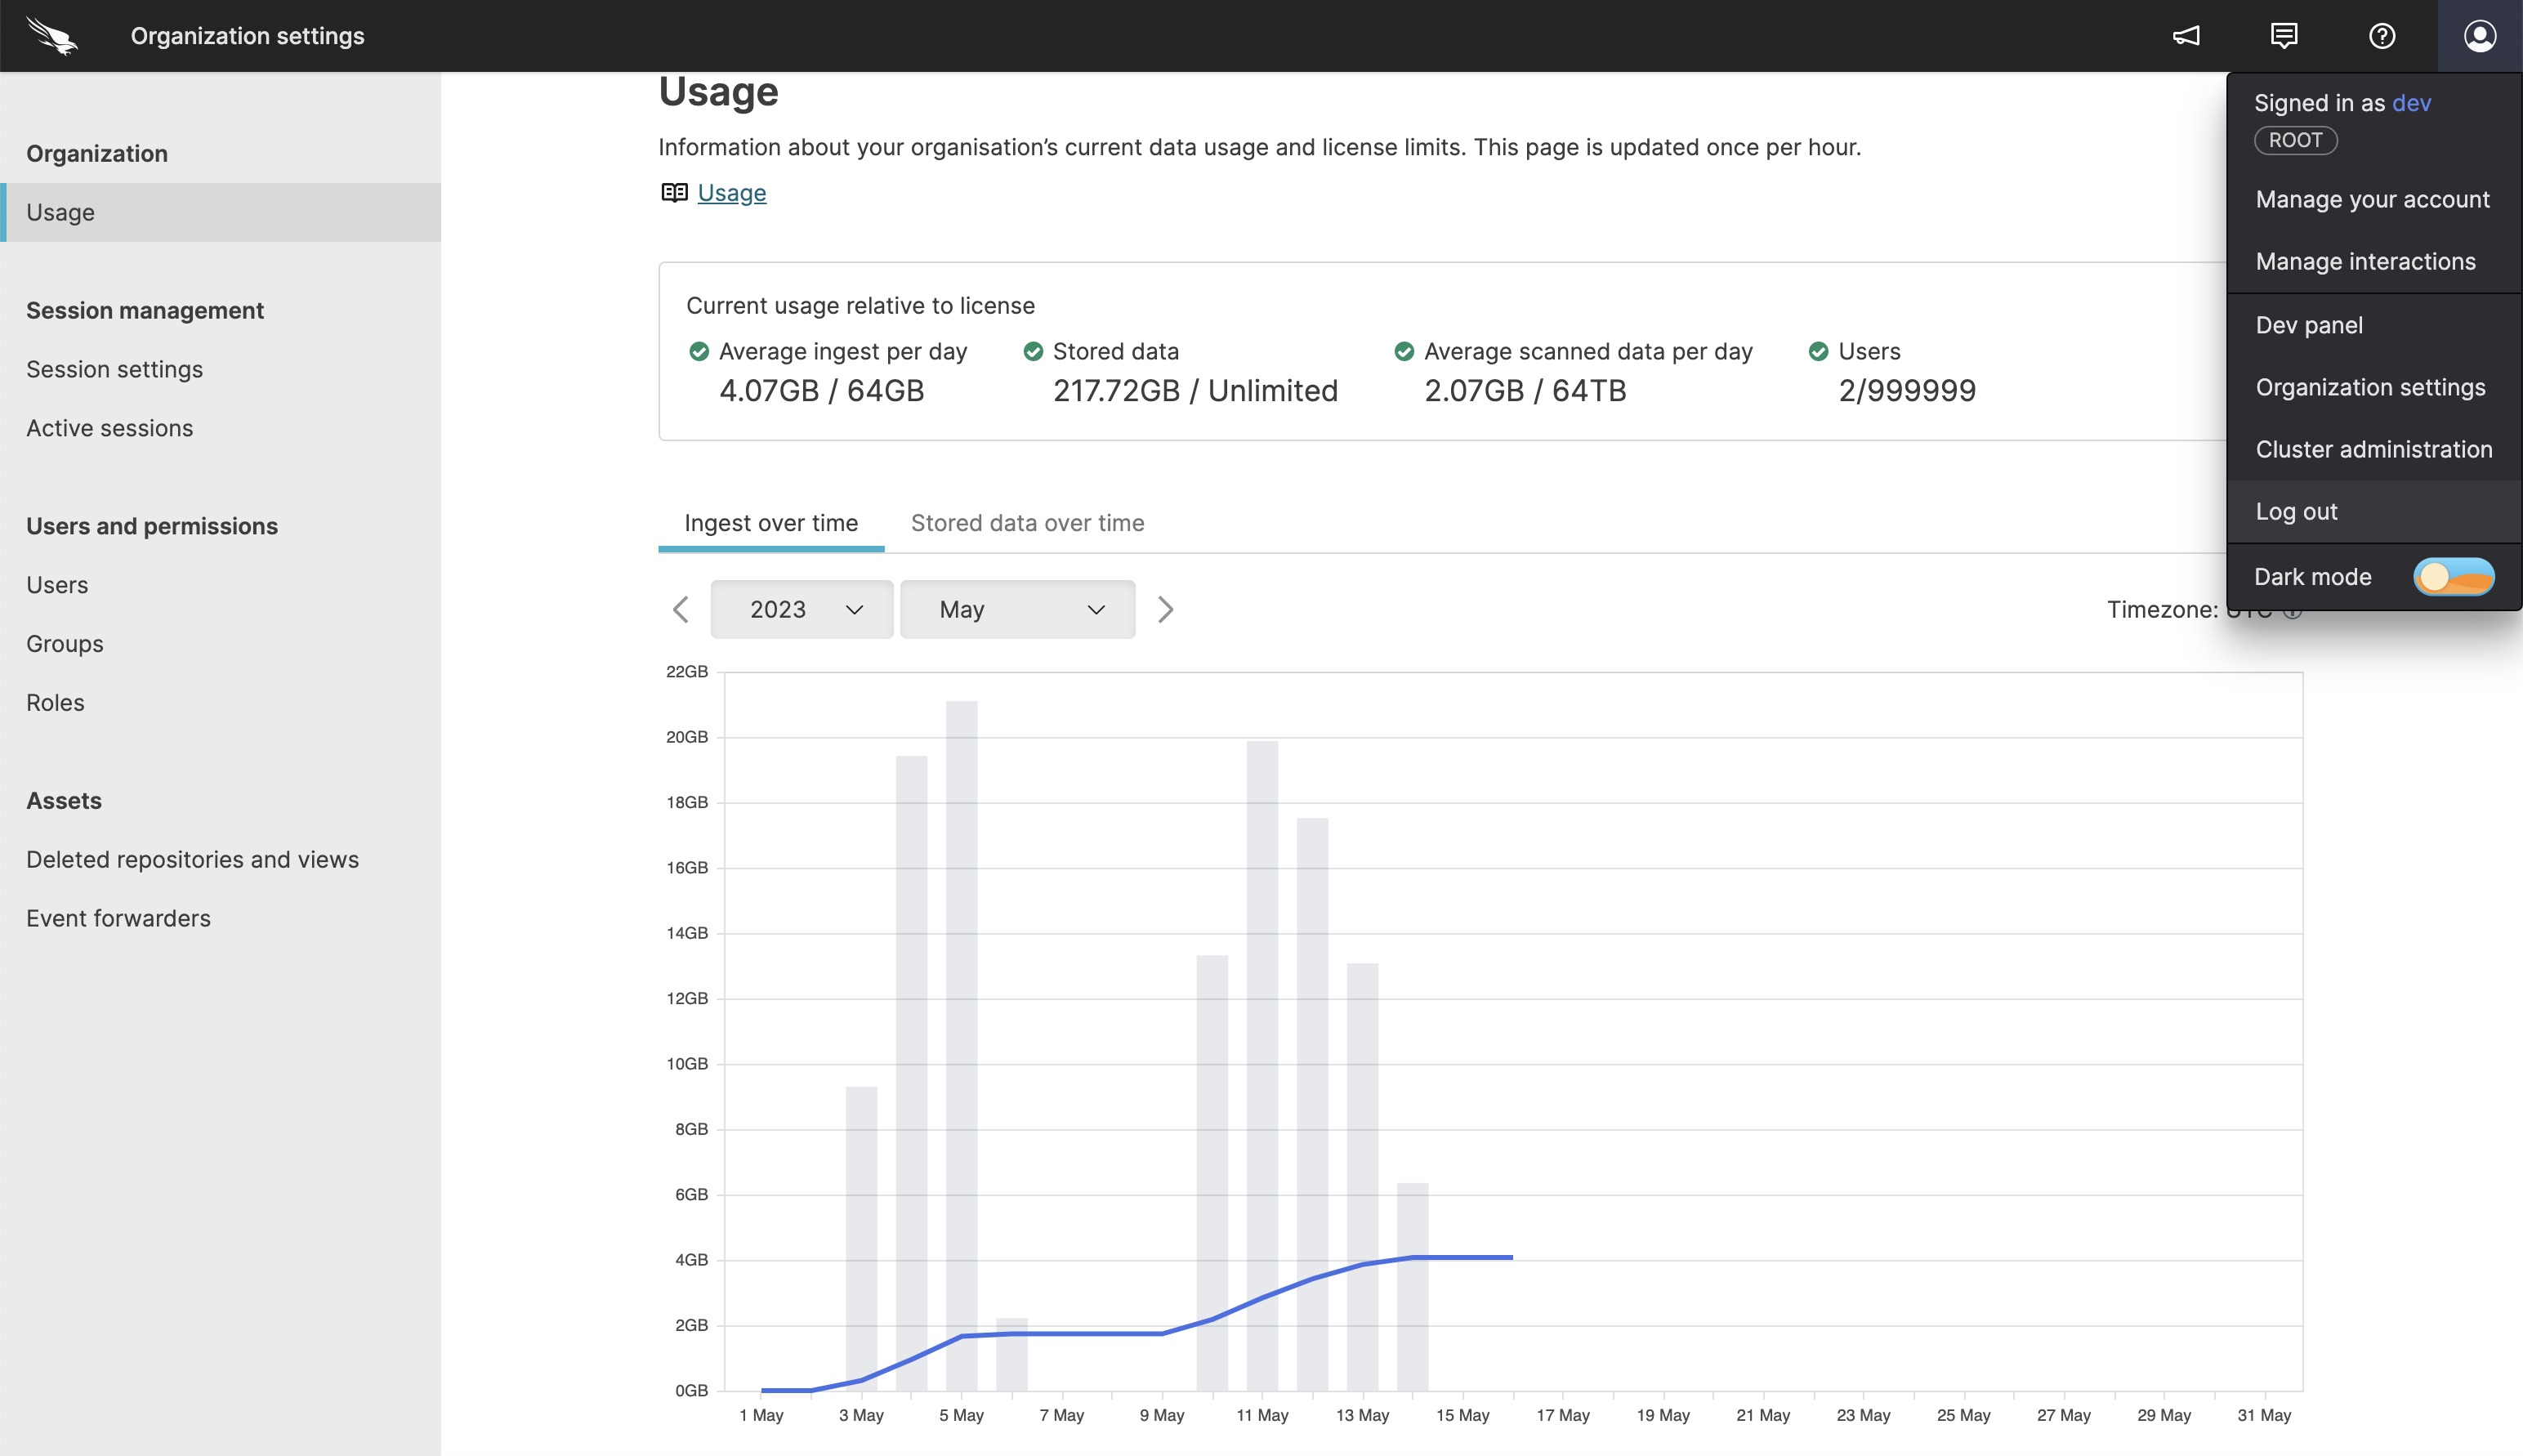 |
Figure 3. Usage Page
Current Usage
The current usage gives you an indication of your usage at the current moment and whether you are going above or below your order form values.
If you're exceeding your contract, the panel will indicate this with a warning.
The calculations displayed on this page do not apply to Falcon Long Term Repository, for information on your Falcon Long Term Repository license usage, please refer to the Usage Reports page in the Falcon Documentation.
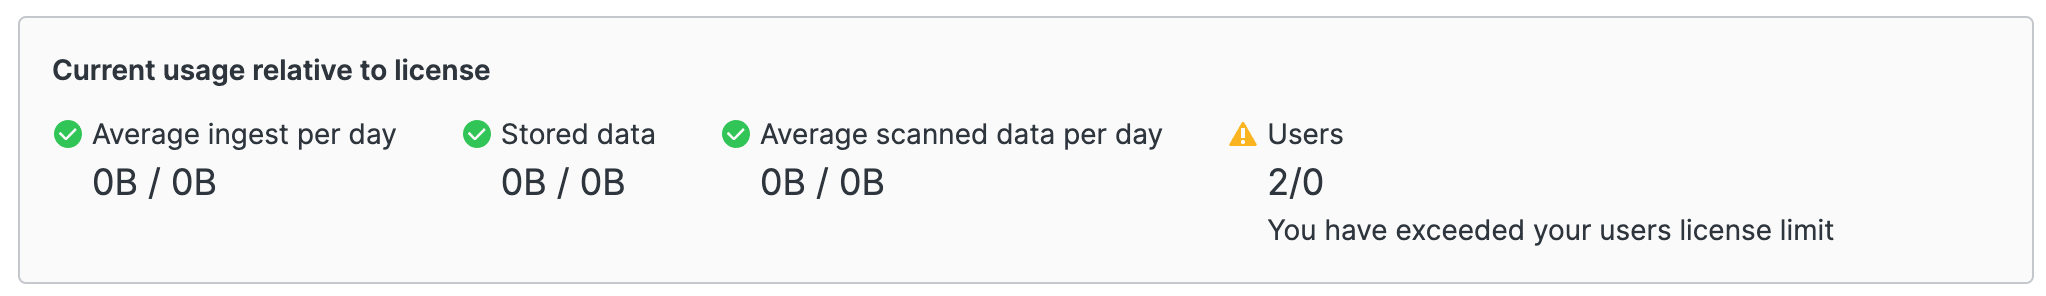 |
Figure 4. Current Usage
The following statistics are displayed:
Average ingest per day
The amount of data in bytes after it was parsed in LogScale. For information on how this is calculated, see Measuring Data Ingest.
Stored data
The amount of data that you have stored in LogScale, in bytes.
Average scanned data per day
Scanned data is the amount of data that was searched through when running queries. Every time a query runs, LogScale measures the amount of data it needs to look into to answer the query.
Users
Number of registered users.
Ingest Over Time
In the ingest chart, you can get an overview of ingestion within a selected time period.
Average ingest per day is calculated as a 30-day moving average. This means, for example, that the value shown for the 15th of July is the average daily ingest in the period 15th of June to 15th of July. This is to allow for spikes in ingest.
The ingest chart also shows the license limit, and an indication for which periods the rolling average has passed the limit.
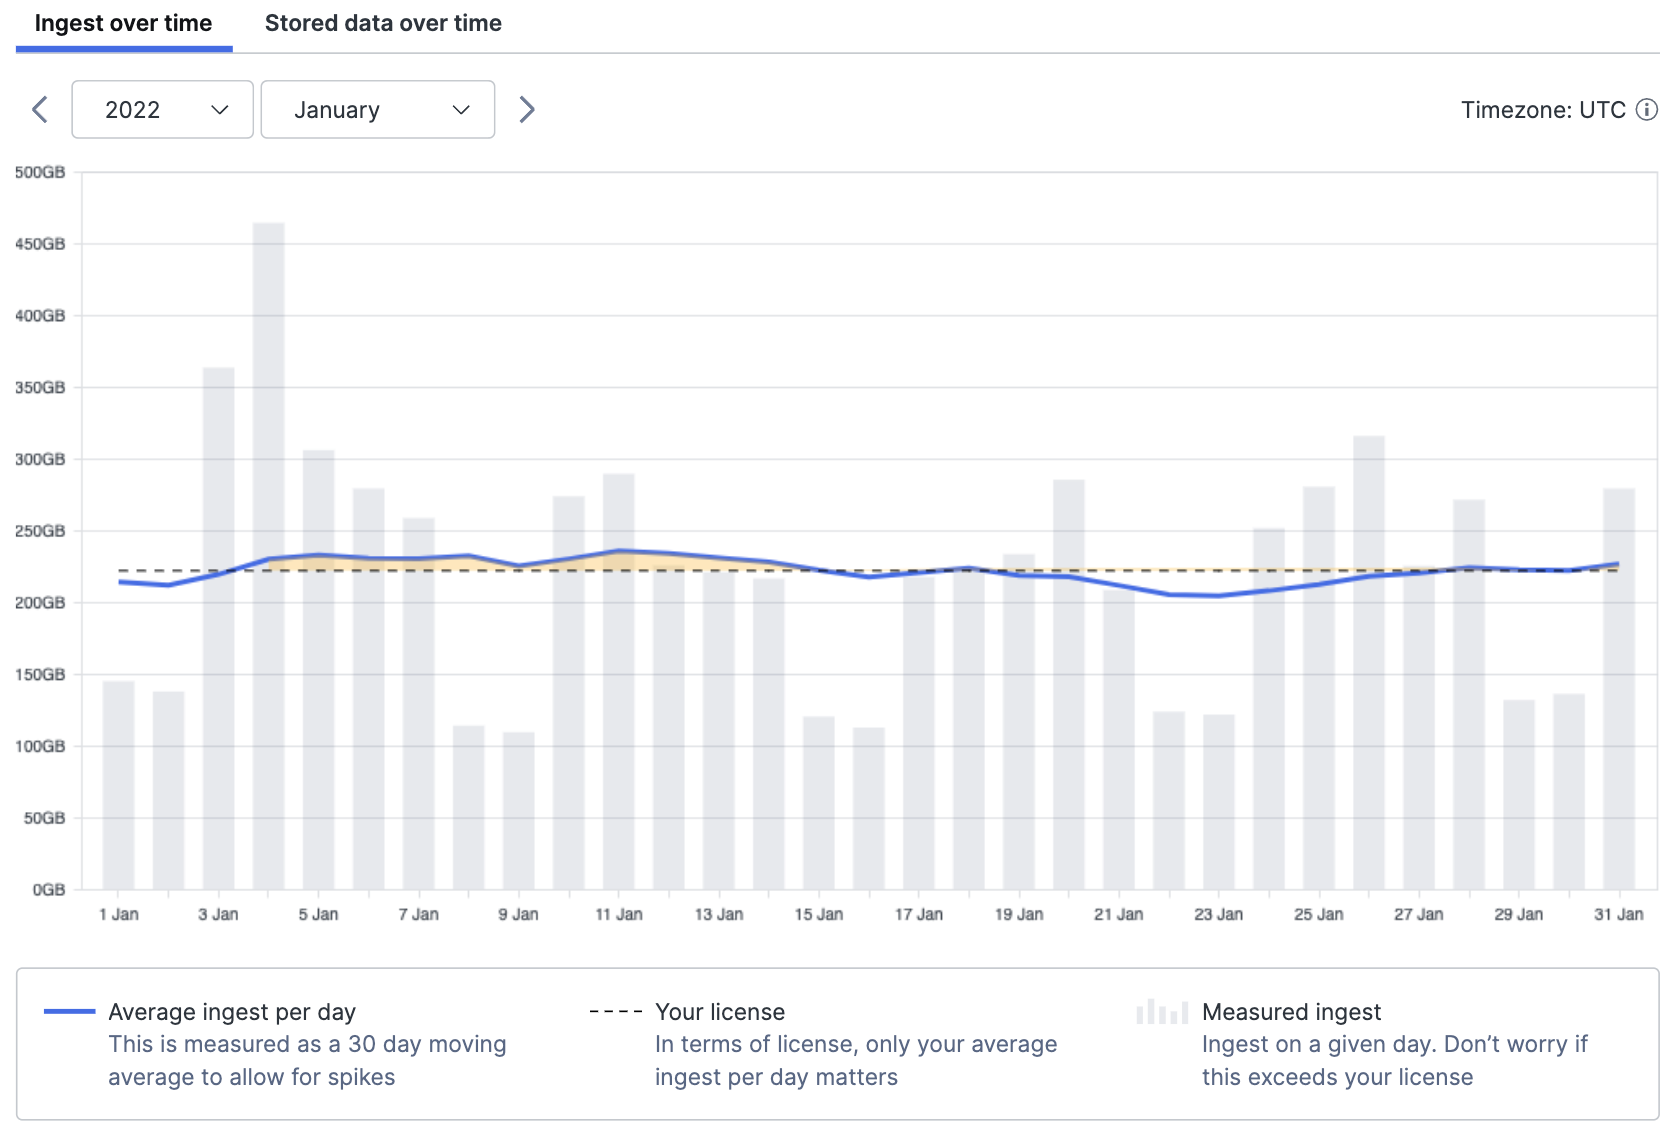 |
Figure 5. Ingest Over Time With Spikes Example
You can select a single date, which will update the data shown in the repository table.
Stored Data Over Time
In the Stored data over time chart, you can get an overview of the storage usage within a selected time period.
The storage chart will also show the license limit and indicate for which periods the storage has passed the limit.
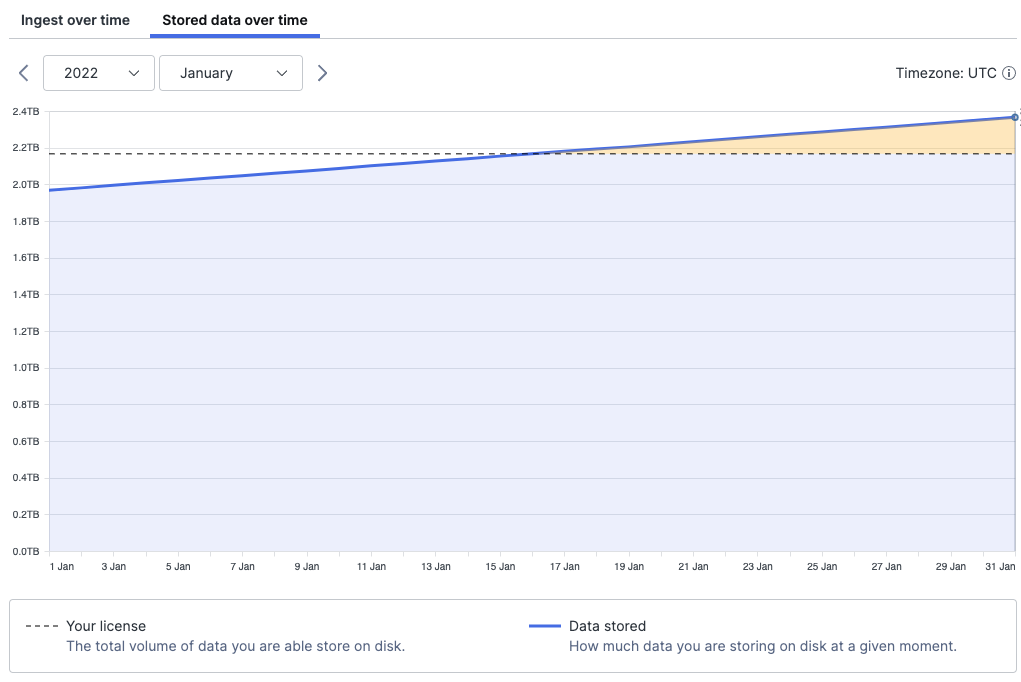 |
Figure 6. Stored data Over Time
As was the case for the ingest chart, you can select a single date, which will update the data shown in the repository table.
Repository Table
For both ingest and stored data, you can get an overview of the usage data based on the repositories that the data is in.
The data shown in the table correlates with the selected year, month and day from the chart.
In the table, you are able to search for specific repositories and sort based on name and value to get a better idea of which repositories have the most or least usage.
From the table, you can navigate to each repository or run a usage query in humio-organization-usage, which will show logs for that particular repository (#repo=NAME_OF_REPO). You must have permission to search in the humio-organization-usage repository for this to work as intended.
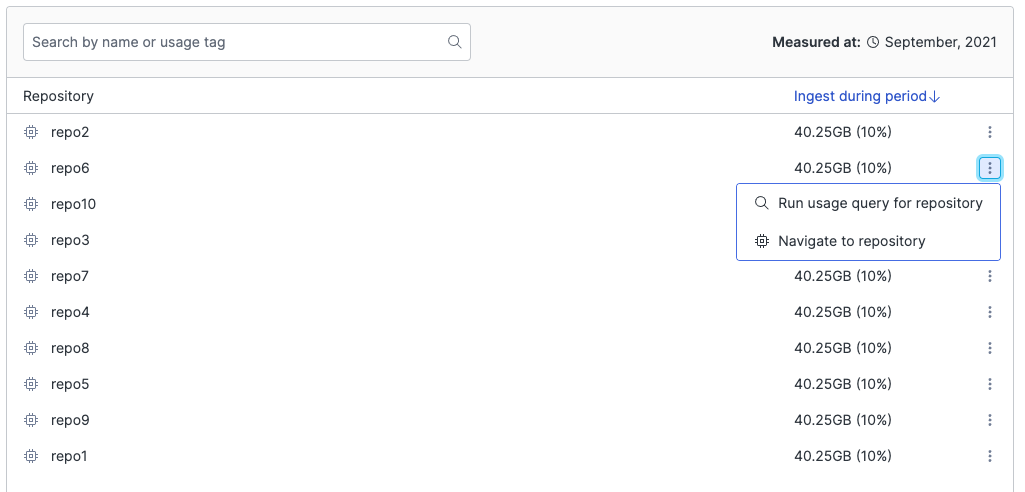 |
Figure 7. Repository Table