
Different Visuals
You can display the data in different types of charts and tables.
On the page, click on the desired view or repository.
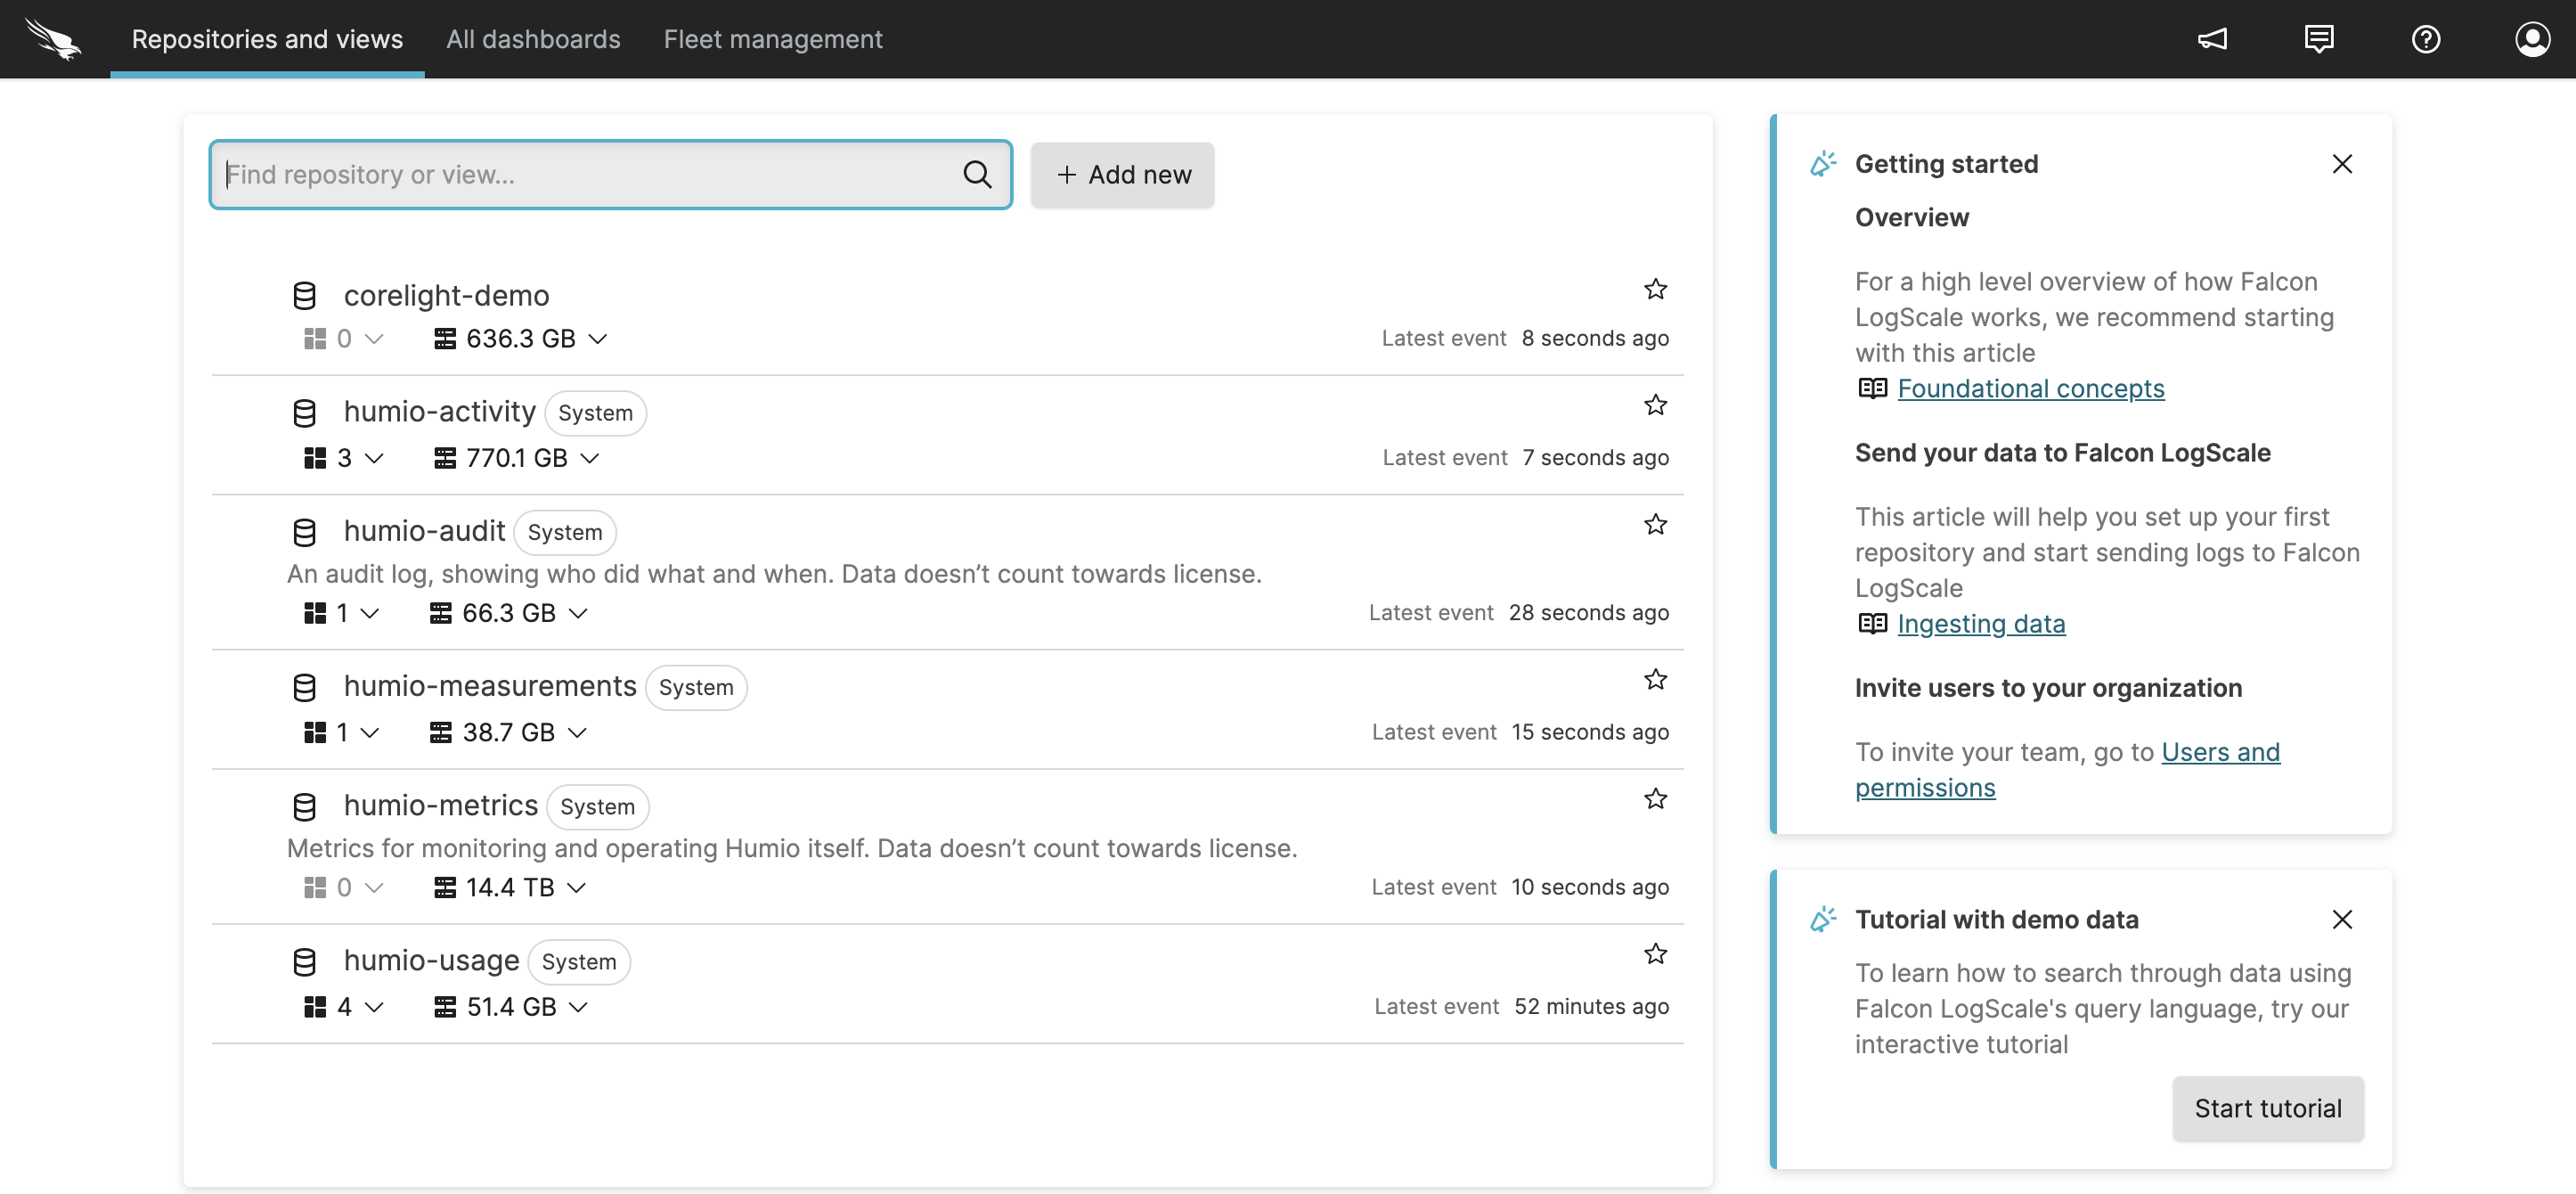
Figure 75. Repositories and Views Page
On the page, click the Widget dropdown, to select which display type to use (default is ). Be aware, that not all data is compatible with all display types. Incompatible data for a chart/table is specified on the menu.
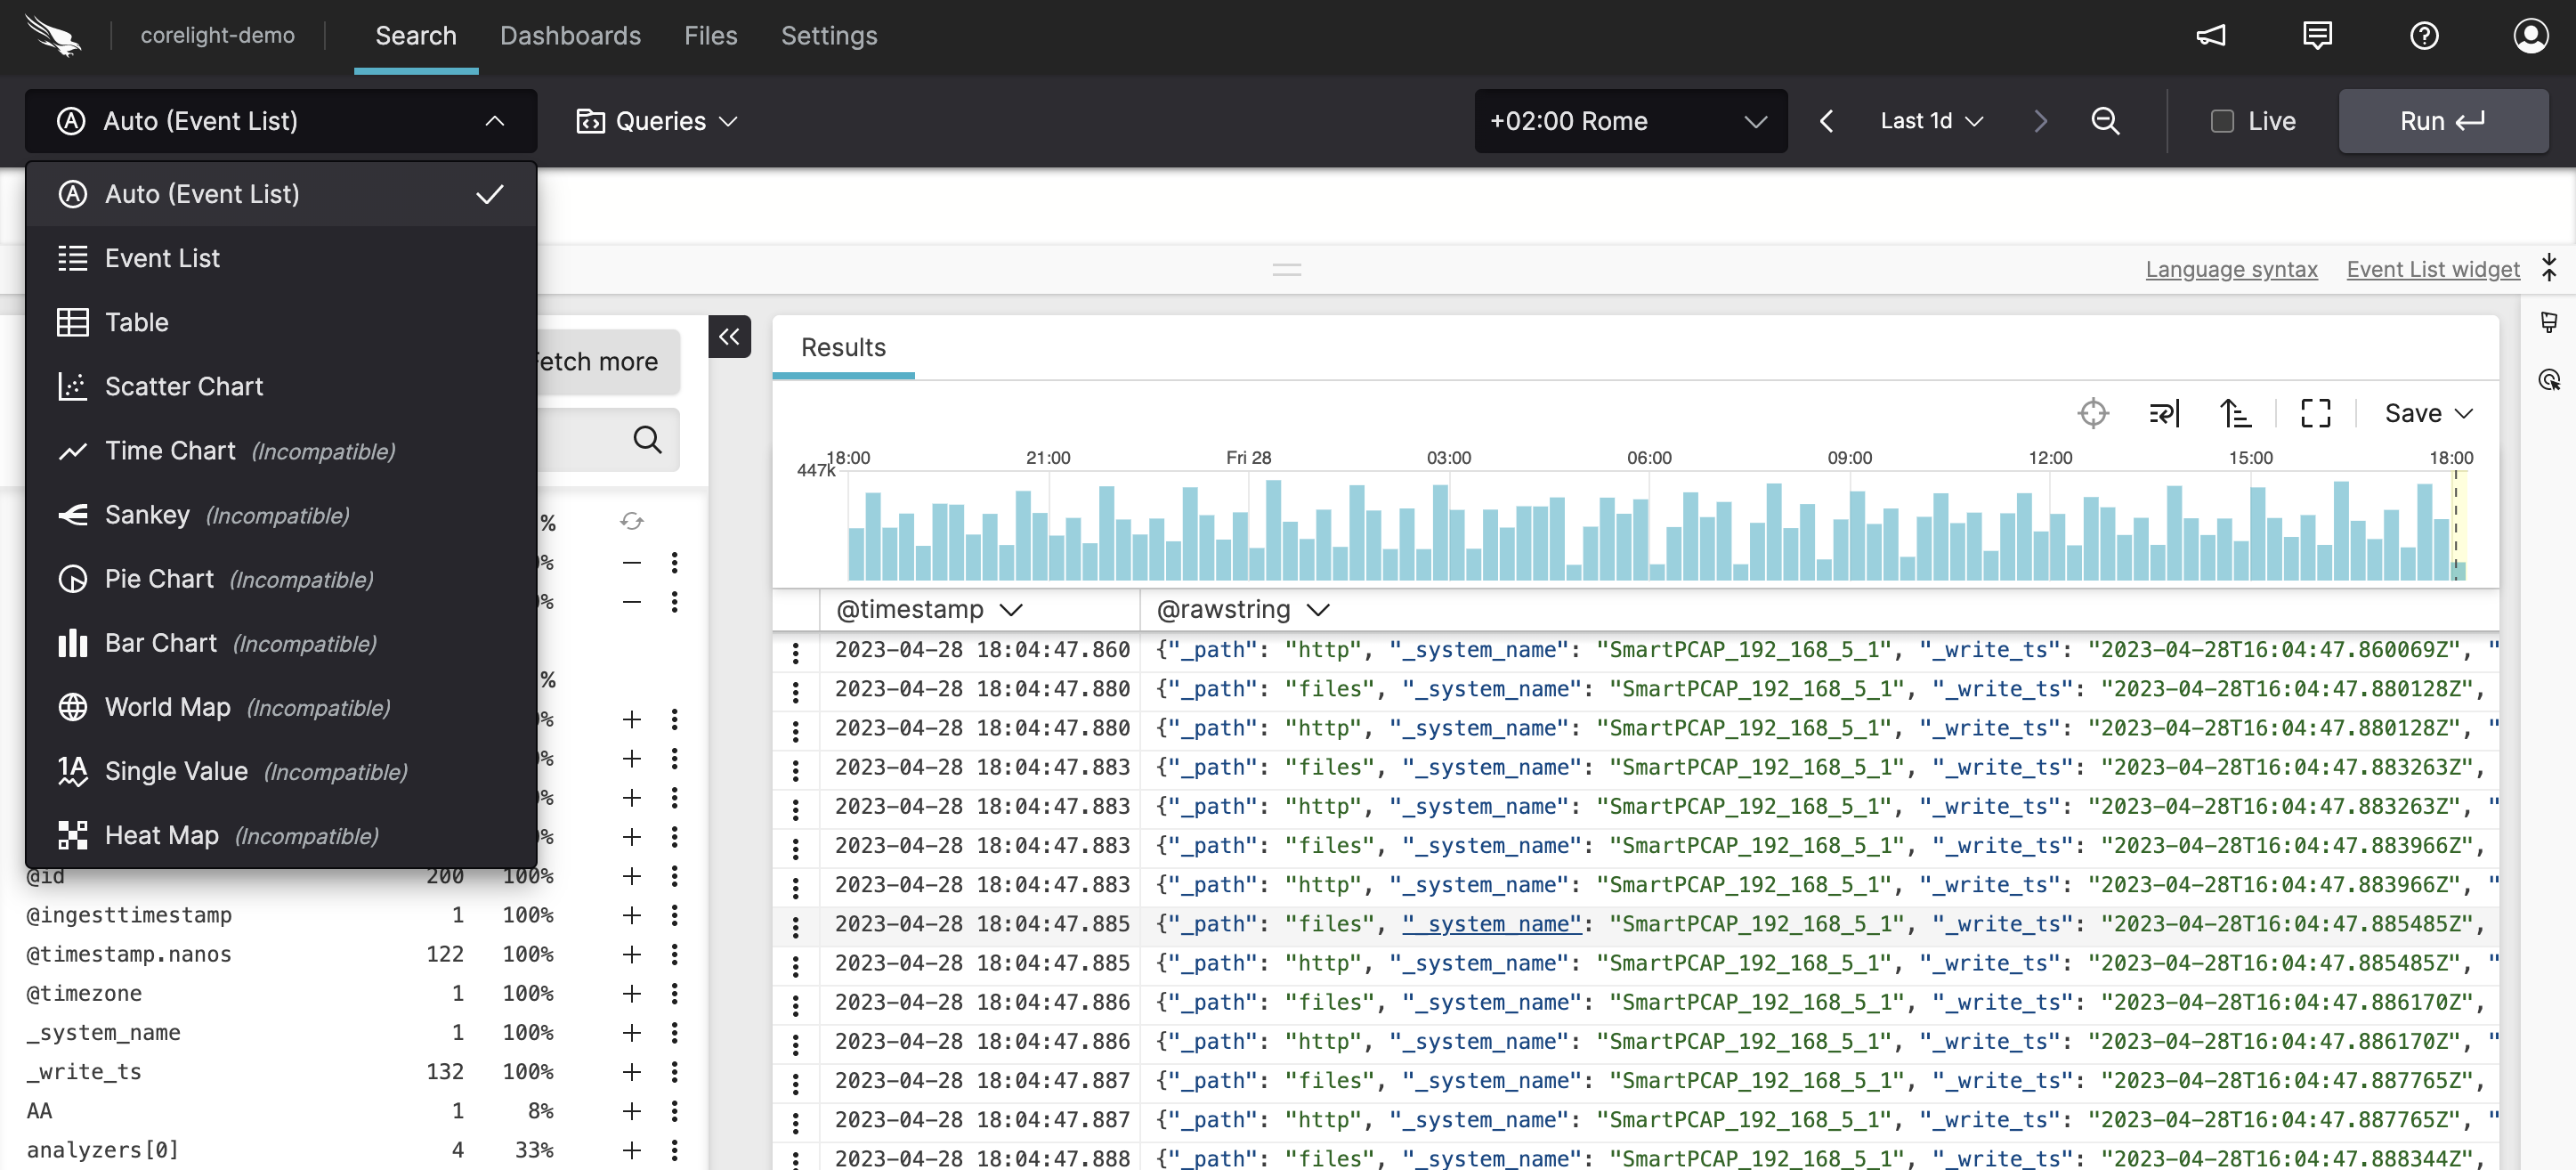
Figure 76. Display Data Menu
Click the icon (the brush) (Tool panel right hand-side of the User Interface) to expand the Format panel — you can change the style of the data displayed (option available depending on the query and the resulting chart):
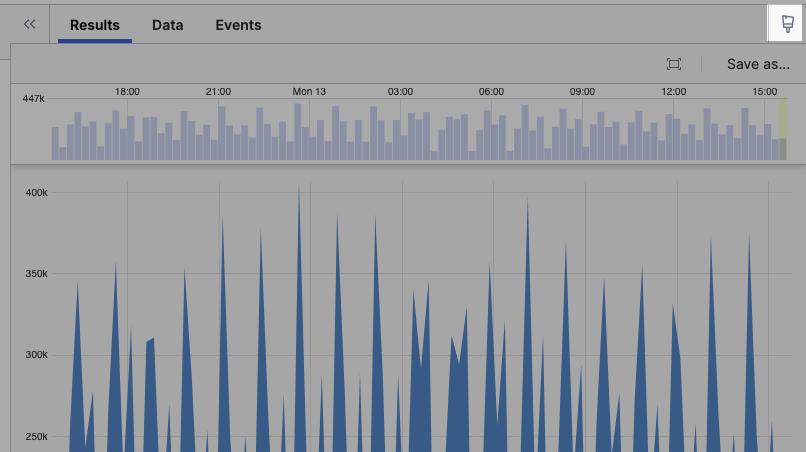
Figure 77. Changing the Chart Style
Click the double arrows to collapse the Format panel.
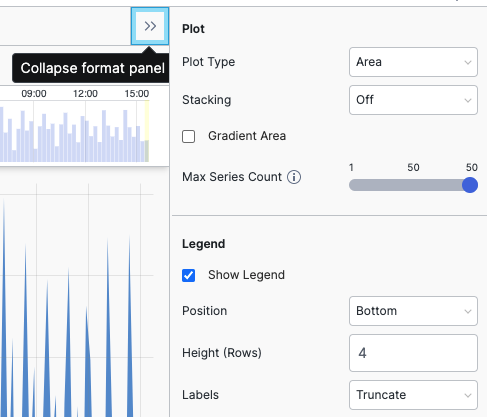
Figure 78. Format Panel