

Azure Service Fabric Log Format
LogScale integrates with Azure Service Fabric. The integration differentiates between
Service Fabric Platform Events that communicate key operational activities happening within a cluster.
Applications running on a Service Fabric cluster such as .NET core applications using Serilog.
Both types are available for searching and analysis in LogScale.
Service Fabric & LogScale
Azure Service Fabric is a distributed systems platform that makes it easy to package, deploy, and manage scalable and reliable micro-services and containers. Developers and administrators can avoid complex infrastructure problems and focus on implementing mission-critical, demanding workloads that are scalable, reliable, and manageable.
LogScale is a log management system, which enables you to log everything and answer anything in real-time. You can send, search, and visualize all logs instantly, easily, and affordably.
Disclaimer: This document is to be considered an example of how you can build out the setup described. It is by no means intended for production usage, without thorough testing. Please refer to documentation of the individual technologies used.
Overview
For the complete solution these steps are involved:
Setting up LogScale.
Creating a running Service Fabric Cluster.
Installing the Cluster Monitor Service.
Creating a parser for the Service Fabric Events ingested by the Cluster Monitor Service. Make sure it's called
servicefabric-platform.Installing Filebeat.
Install or Update Cluster Monitor
The following procedure describes how to install or update the ClusterMonitor service, using the VMSS Custom Scripts Extension.
Update
eventFlowConfig.jsonwith the LogScale ingest token to be used and letserviceUripoint to your LogScale cluster.Upload the following files to a location, accessible through https:
InstallClusterMonitor.ps1
ClusterMonitor.zip
eventFlowConfig.1.json
Change the
clusterMonitor_artifactsLocationparameter in the ARM template parameter file to that location. (If you are setting up a new cluster, refer to the Cluster ARM instructions.Change the
forceUpdateTagin the extension to a different string, for example, use as version number.Update the scale set model or re-run SF cluster deployment as an incremental deployment.
Logging when running distributed applications in a Service Fabric cluster
In a Service Fabric setup, there are three layers of logging which need to take place
infrastructure (servers)
platform (Service Fabric runtime)
applications (your distributed applications running in the cluster).
For more information about these concepts, please refer to the service fabric diagnostics overview.
As an example, there are various metrics and logs we want to collect on all three layers, and we can use different collection methods to accomplish this. Typically by installing an agent. In the case of using LogScale as a logging and monitoring tool for a Service Fabric installation, we are using the following components:
| Layer | Instrument and Emit | Collect | Query and Analyze |
|---|---|---|---|
| Infrastructure | Hardware, Windows, OS, using syslog, ETW, performance counters. | Not covered | Not covered |
| Platform | Service Fabric cluster and runtime using ETW. | ClusterMonitor service, using Microsoft.Diagnostics.EventFlow | LogScale |
| Applications | Serilog for .net core outputting to log files. | Filebeat | LogScale |
For the infrastructure layer which we are not covering in this article,
we suggest taking a look at
Metricbeat
and
Winlogbeat
which also integrate with LogScale. LogScale offers excellent
compression of ingested data (10x) and maintains no indices that take up
your disk space and slow down your ingest, supporting the philosophy of
logging everything.
Platform
The Service Fabric platform writes several structured events for key operational activities happening within your cluster. These range from cluster upgrades to replica placement decisions. Each event that Service Fabric exposes maps to one of the following entities in the cluster: Cluster, Application, Service, Partition, Replica and Container.
See Service Fabric events for full details.
The platform events are collected by an external service that runs on
each machine participating in the cluster to the Service Fabric itself.
The service utilizes the
EventFlow
diagnostics library which have support for several Inputs and
Outputs of different formats. In our case the relevant Input is ETW
(Event Tracing for Windows) since the Service Fabric Platform Events are
available as an ETW provider. The Output is
ElasticSearch. LogScale has support for
the Elasticsearch bulk API for easy integration with existing log
shippers and agents.
Details for installing the service can be found in Install or Update Cluster Monitor.
Note
For the sake of this example, we have increased the verbosity of the runtime to capture as much data as possible.
Parsing Service Fabric Platform Events with LogScale
For the ETW log lines produced by Service Fabric and shipped by EventFlow we are going to write a custom parser in LogScale. Parsers are written in LogScale's query language.
Creating a new parser in LogScale means going to the repository used
for ingesting data, and selecting
Parsers → . Make sure to call the parser
servicefabric-platform.
Afterwards the parser should be assigned to the ingest token to be
used, which is done under →
. You can then change the
Assigned Parser through a
drop-down box.
The ingest token configured here is used together with the Cluster Monitor Service described above.
The Service Fabric log lines contain both structured and unstructured data. Here's an example (formatted for clarity):
`{
   "keywords" : 1152921504606846977,
   "level" : 4,
   "payload" : {
      "EventName" : "PerfMonitor",
      "ID" : 1284,
      "Message" : "Thread: 12, ActiveCallback: 1, Memory: 18,223,104, Memory Average: 18,223,104/18,051,085 ",
      "activeCallback" : 1,
      "longavg" : 18051085,
      "memory" : 18223104,
      "shortavg" : 18223104,
      "threadCount" : 12
   },
   "providerName" : "Microsoft-ServiceFabric",
   "timestamp" : "2019-02-26T10:40:51.0501913+00:00"
}`
As the log line stands right now it is ill-fit for a human operator. Reading the json data carefully we see that the Message fields are basically a summary of some of the other fields and represents a nice overview. Our parser will instead present this line in LogScale:
`2019-02-26 11:40:51.050
| 4
| Microsoft-ServiceFabric
| PerfMonitor
| 1284
| Thread: 12, ActiveCallback: 1, Memory: 18,223,104, Memory Average: 18,223,104/18,051,085`
In other words, timestamp followed by
level,
providername,
eventname,
eventid and the message we identified
before. The parser code we end up with is:
parseJson()
| @timestamp := parseTimestamp(field=timestamp)
| @display := format(format="%s
| %s
| %s
| %s ", field=[providerName, payload.ID, payload.EventName, payload.Message])
| kvParse()
We start out by calling parseJson() which parses
the log line as json and makes the json members available as fields on
our event. The result is
then piped into parsing of the timestamp field which is assigned to a
new @timestamp field. LogScale interprets
@timestamp as the event time, so it's essential
to get right. If we do not want to display the raw log line in
LogScale, in this case json, the
[@display]
(event) field can be set to
some formatted string. We finish the parsing by extracting any key
value pairs, like foo=bar, from the
original log line.
Note
In newer versions of LogScale, @display is no longer supported. We recommend using the column-based event list that allows for selection of specific fields. In the above parser simply leave the line containing @display out.
Applications
For the sample below, we are using Serilog and Filebeat for log shipping.
Serilog
Serilog is a popular logging framework for .NET. Serilog is focused on structured logging. Doing structured logging means thinking about how the logs will be searched and analyzed afterwards, such as instrumenting a program with
Log.Information("Number of user sessions {@UserSessions}", userSessionCount);;
Should make it easy to aggregate
UserSessions in your log management
system afterwards. With serilog you can configure where and how your
log lines are outputted. The option we are going to choose is writing
JSON formatted log lines to files. The above line would read as:
{"Timestamp":"2019-01-28T09:38:08.3192070+01:00","Level":"Information","MessageTemplate":"Number of user sessions {@UserSessions}","RenderedMessage":"Number of user sessions 115","Properties":{"UserSessions":115}}With the following configuration in code:
var log = Path.Combine("log", $"ConsoleExample.log");
Log.Logger = new LoggerConfiguration()
             .Enrich.FromLogContext()
             .Enrich.With(new ServiceFabricEnricher())
             .WriteTo.File(
                 formatter: new JsonFormatter(renderMessage: true),
                 path: log,
                 retainedFileCountLimit: 5,
                 shared: true)
             .CreateLogger();
Note the renderMessage: true part of
the configuration. This instructs Serilog to render the message as
part of the formatted log output which ends up in our log files. As
before we will use the @display feature in
LogScale which allows us to display the rendered message instead of
the raw json data. This makes it easier for a human to process the log
lines. All data is still available though, for searching and
inspection in LogScale.
Our ServiceFabricEnricher class
enriches our log lines with information from the node which the
service instance is running on:
public class ServiceFabricEnricher : ILogEventEnricher
   {
    private static readonly string instanceId = Guid.NewGuid().ToString();
    private static readonly string processId = Process.GetCurrentProcess().Id.ToString();
    private static readonly string node = Environment.GetEnvironmentVariable("Fabric_NodeName");
    private static readonly string service = Environment.GetEnvironmentVariable("Fabric_ServiceName");
    private static readonly string application = Environment.GetEnvironmentVariable("Fabric_ApplicationName");
    public void Enrich(LogEvent logEvent, ILogEventPropertyFactory propertyFactory)
    {
        if (!string.IsNullOrWhiteSpace(instanceId))
        {
            logEvent.AddPropertyIfAbsent(new LogEventProperty("InstanceId", new ScalarValue(instanceId)));
        }
        if (!string.IsNullOrWhiteSpace(node))
        {
            logEvent.AddPropertyIfAbsent(new LogEventProperty("Fabric_NodeName", new ScalarValue(node)));
        }
        if (!string.IsNullOrWhiteSpace(service))
        {
            logEvent.AddPropertyIfAbsent(new LogEventProperty("Fabric_ServiceName", new ScalarValue(service)));
        }
        if (!string.IsNullOrWhiteSpace(application))
        {
            logEvent.AddPropertyIfAbsent(new LogEventProperty("Fabric_ApplicationName", new ScalarValue(application)));
        }
        if (!string.IsNullOrWhiteSpace(processId))
        {
            logEvent.AddPropertyIfAbsent(new LogEventProperty("ProcessId", new ScalarValue(processId)));
        }
    }
 }
Writing to a log file instead of shipping the logs in-process is a deliberate decision. The file acts as a persistent buffer between your program and your log management system which enables us to handle retransmissions and long lasting bursts of log lines.
Filebeat
We have our application logs formatted in JSON and written to files on disk, what's still missing is shipping the logs to LogScale. Filebeat is a lightweight, cross platform shipper that is compatible with LogScale. Filebeat uses few resources, is easy to install and handles network problems gracefully.
The following filebeat configuration scrapes all logs from
D:\\SvcFab\_App and subfolders named
log with files ending in
.log. LogScale is compatible with the elastic
bulk API so we are using
output.elasticsearch. The
hosts parameter points to
LogScale server. The $INGEST_TOKEN needs to be
replaced by a valid Ingest Token. Ingest Tokens are used in LogScale
to identify clients, selecting a repository for the incoming logs and
selecting which parser should be used.
filebeat.inputs:
- type: log
  enabled: true
  paths:
    - "D:\\SvcFab\\_App\\**\\log\\*.log"
  encoding: utf-8
output.elasticsearch:
  hosts: ["https://humio.server.com:443/api/v1/ingest/elastic-bulk"]
  username: $INGEST_TOKEN
  compression_level: 5
  bulk_max_size: 200
  worker: 1
We need to get the $INGEST_TOKEN from LogScale. A
default ingest token is configured for your log repository in
LogScale. Log in to LogScale, go to your log repository, click
Settings and then Ingest API Tokens' and either retrieve the default
or create a new one. When you send logs and metrics to LogScale for
ingestion it needs to be parsed before it is stored in a repository.
LogScale has a built-in parser for Serilog that is configured as
above. Make sure the Serilog parser is selected for the ingest token
used. This is done by selecting the parser in the dropdown 'Assigned
Parser' next to the Ingest Token.
If you are experimenting with filebeat from the command line start
filebeat with filebeat.exe -e -c
filebeat.yml. The -e flag
instructs filebeat to log to the console which is useful when
experimenting with the configuration.
Query & Analyze
This section contains some examples of using the humio query language to analyze and visualize the data.
Searching Application Logs
Let's take a look at a simple free text search in LogScale
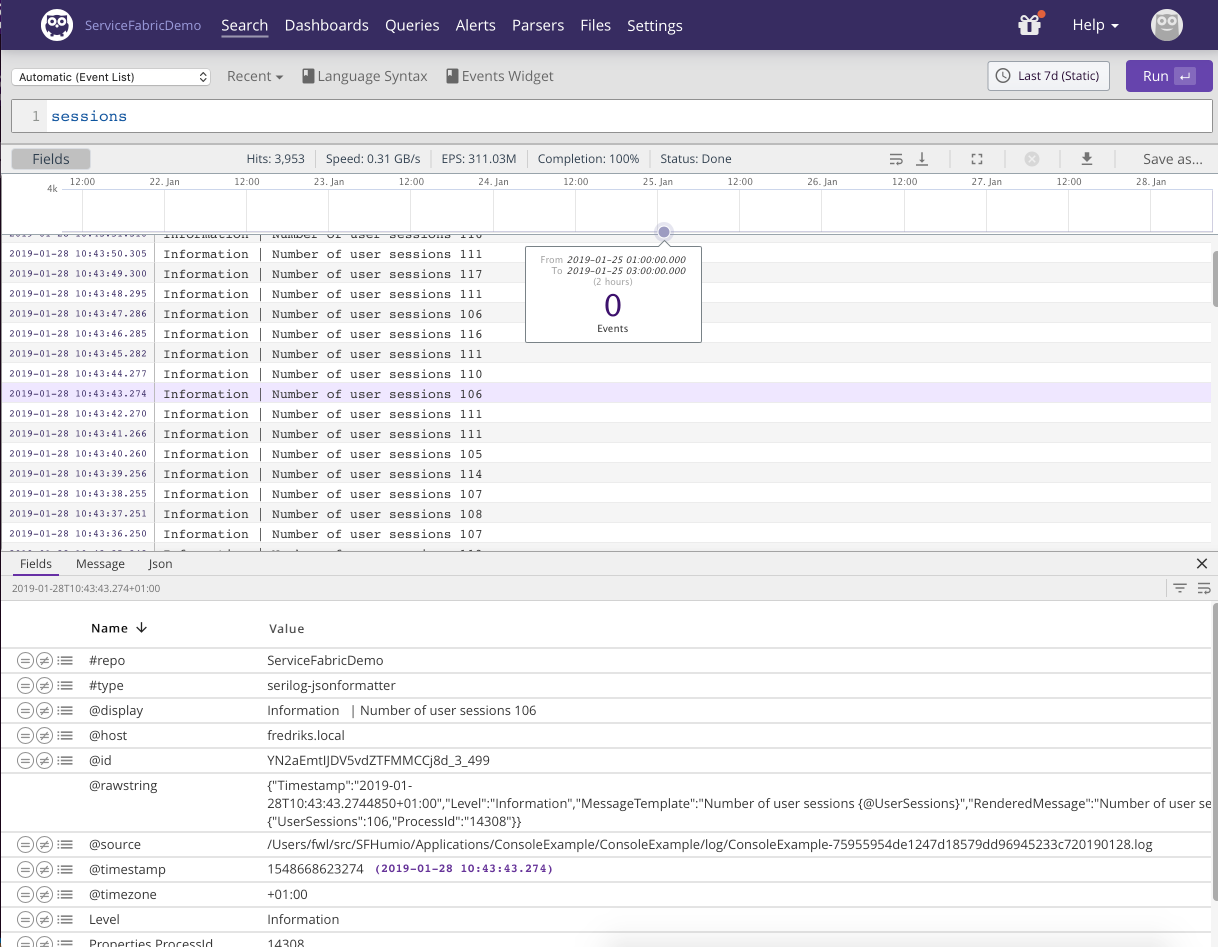 |
Figure 9. Free Text
We have searched for the word sessions, the result is displayed below and a specific log line has been selected with the details shown below the event list.
Let's say we want to plot the average number of user sessions the last hour:
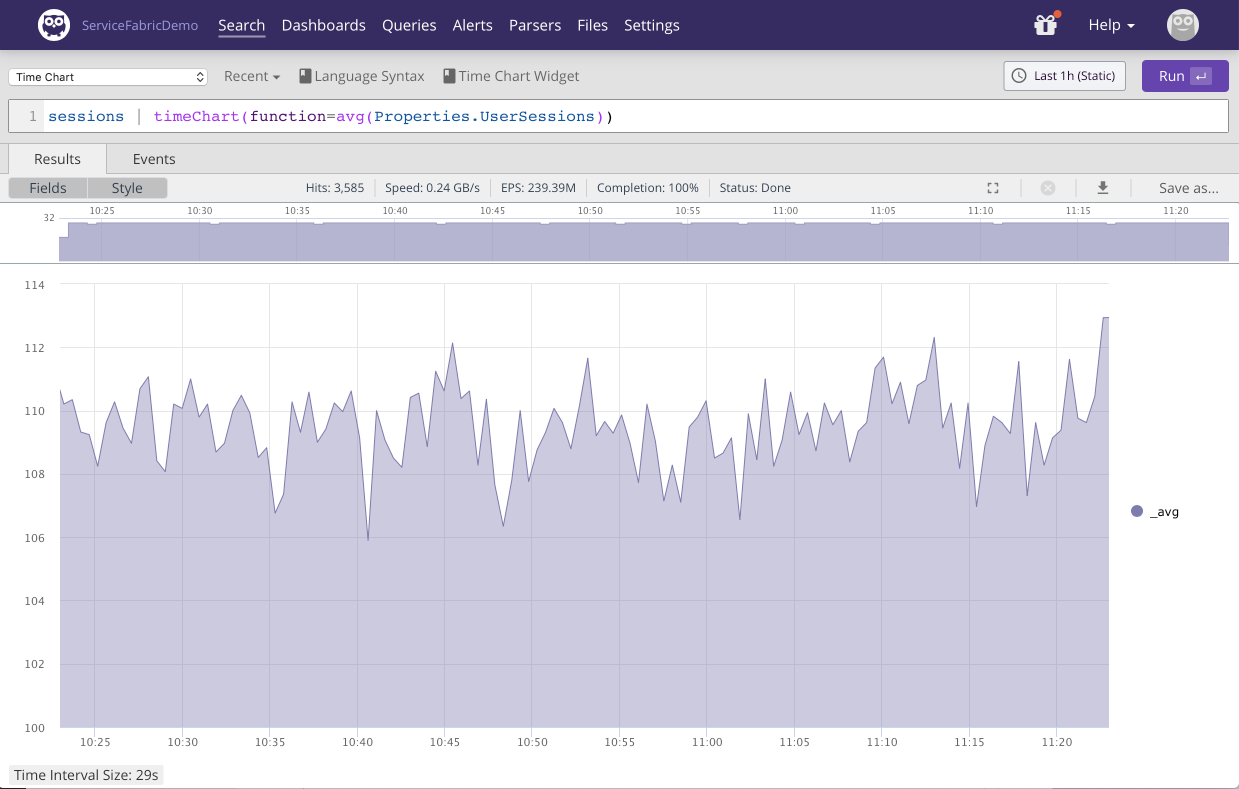 |
Figure 10. Sum Timechart
The query pipes events containing
sessions (through the
| operator) into the
timeChart() query function which uses the
avg() function. Consult the docs for more on
Query Language Syntax and Query Functions.
Notice the `Properties.UserSessions.
This is a structured part of the Serilog log line that allows for easy
analysis. For any unstructured part of your log data that isn't turned
into a property on your events by the parser, LogScale allows for
extracting the data using regular expressions which are then added as
one or more fields to the events in question. See the query function
regex() for more information.
Often we want to get an overview of exceptions being thrown by our applications:
Level=Error
| groupby(field=[Properties.Fabric_ApplicationName, Exception])
The query groups exceptions by application name and exception message. Getting a total count of application exceptions can be achieved by:
Level=Error
| count()
LogScale never rejects incoming logs, even logs it for some reason cannot parse. Doing the search:
@error=*
|
groupBy(@error_msg)
Will reveal any events that haven't been properly parsed and group them by reason.
Searching Service Fabric Platform Events
Service fabric node activity can be detected by looking at Node lifecycle events.
The following query visualizes the different node activities happening in the cluster the last 24 hours:
#type=servicefabric-platform payload.eventName=Node*
| timechart(series=payload.eventName)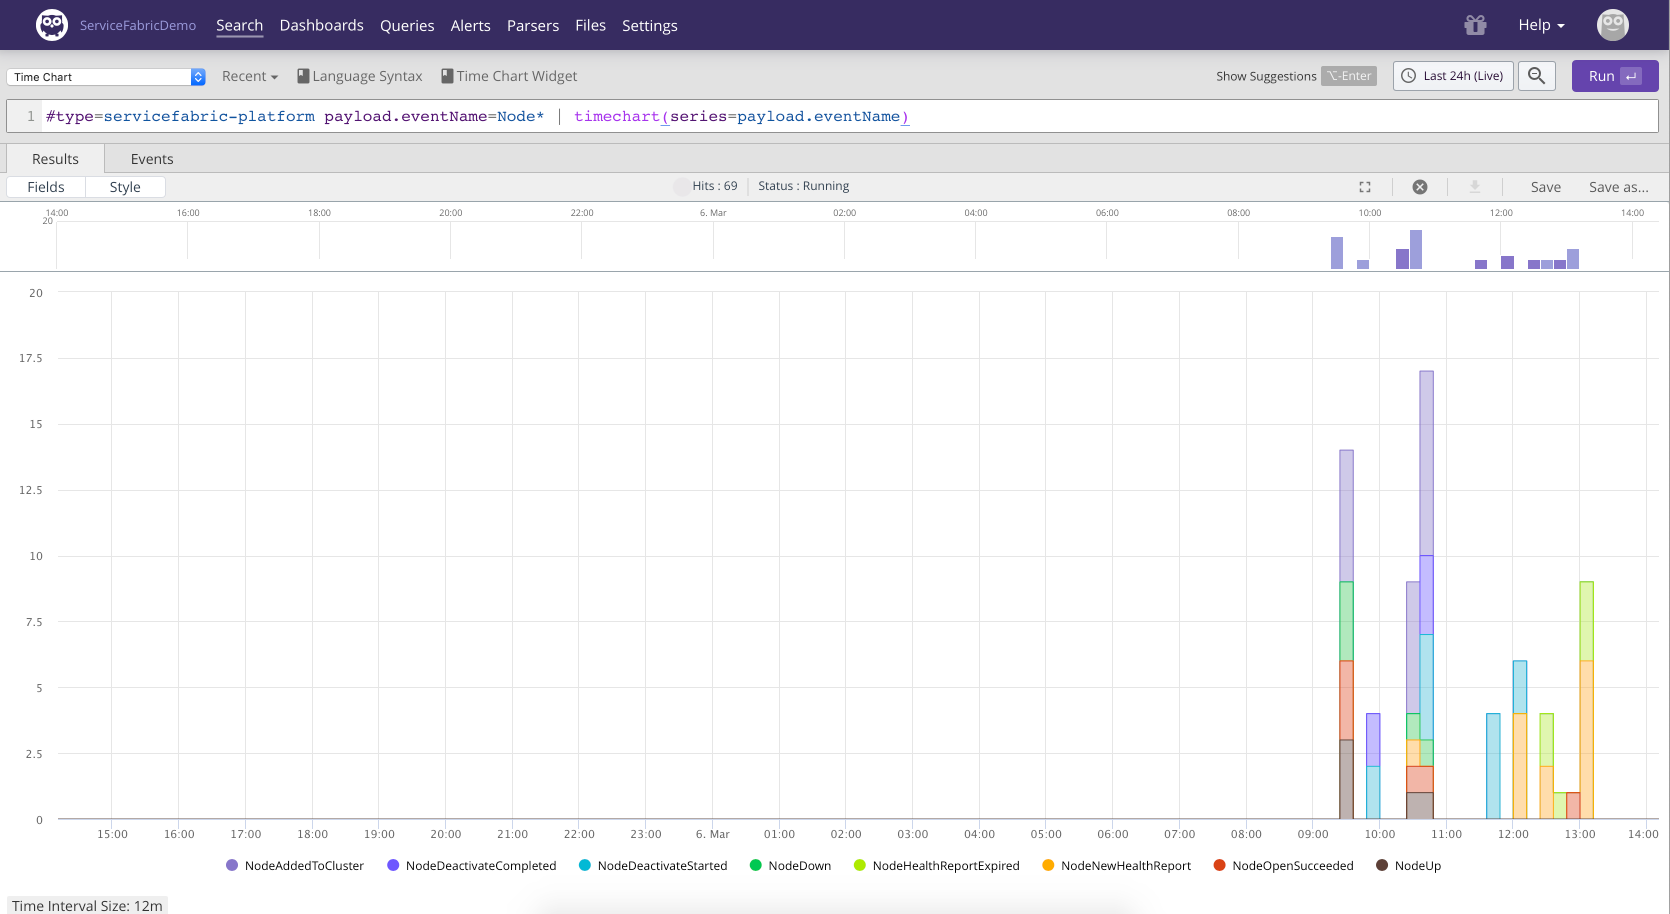 |
Figure 11. Node Activity
With the following approach we group node activity by the name of the node and collect all activity events into a single field which gives us a nice overview of the different activities related to a node.
#type=servicefabric-platform payload.eventName=Node* payload.eventName=*
| groupby(payload.nodeName, function=collect(fields=payload.eventName))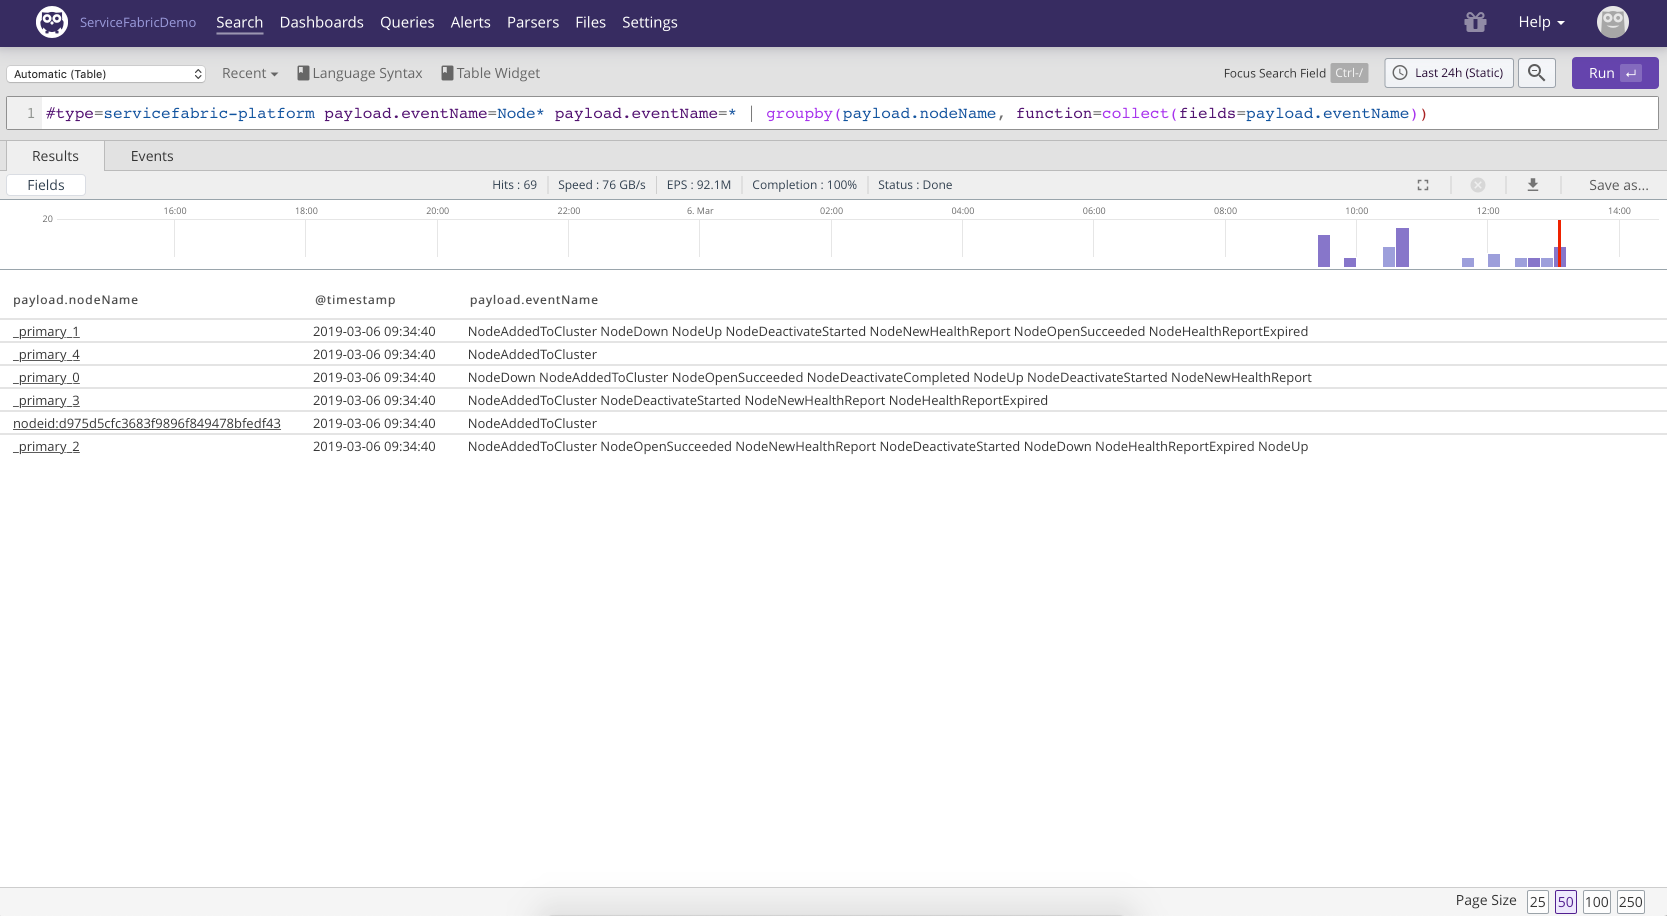 |
Figure 12. Node Activity 2
Digging around in the logs from Service Fabric reveals an interesting event type that we can use to build a few gauges related to node state.
#type=servicefabric-platform payload.ID=18601
| tail(1)
| max(payload.nodeCountsdeactivatedNodes)
The same message also contains information about the number of nodes currently down:
#type=servicefabric-platform payload.ID=18601
| tail(1)
| max(payload.nodeCountsdownNodeCount)
In the drop-down above the search text field we can select the widget type 'Gauge'. We can save to a new or existing dashboard by clicking Save as....
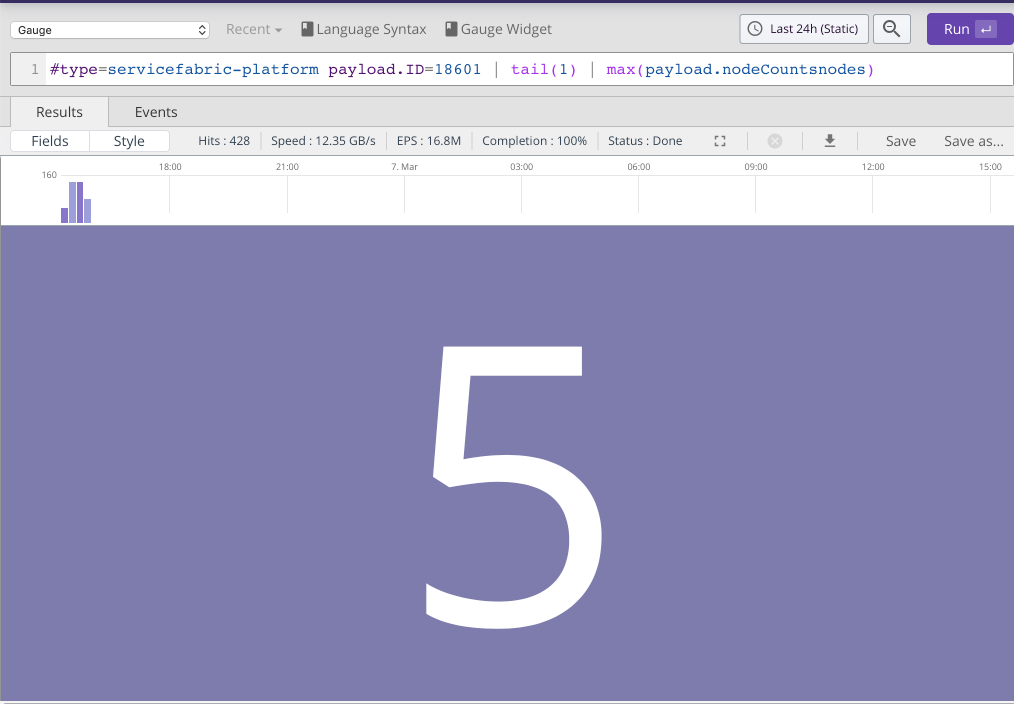 |
Figure 13. Node activity 3
While we can try and infer node health given the node activity service fabric also provides health reports. Health reports are also communicated as health report events.
For a cluster that is having issues health reports can be a significant fraction of the total number of events:
#type=servicefabric-platform
| groupby(payload.category)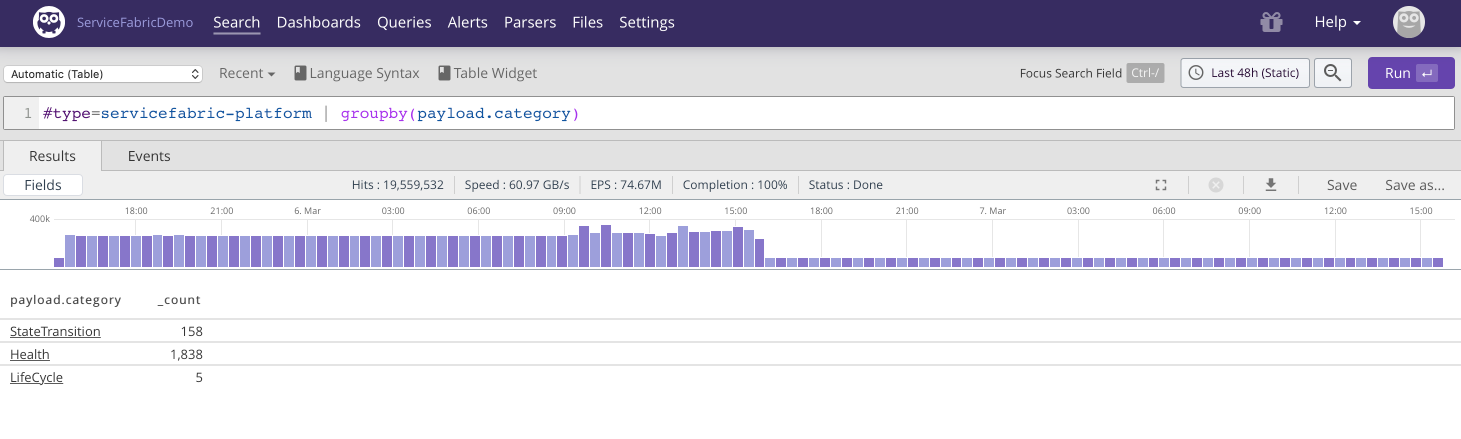 |
Figure 14. Health Reports 1
Clicking on Health in the above search
result reveals amongst others the
NodeNewHealthReport. Let's try and get
an overview of those:
#type="servicefabric-platform"
| payload.eventName = NodeNewHealthReport
| groupby(field=[payload.description, payload.healthState])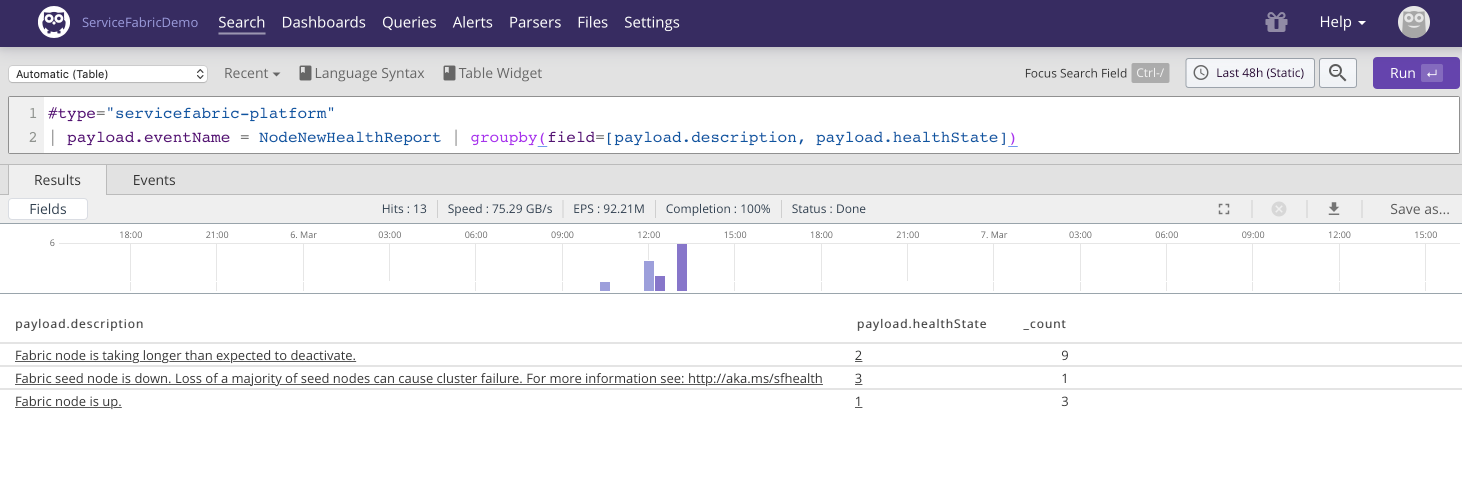 |
Figure 15. Health Reports 2
According to the
documentation
payload.healthState=3 is an
Error and needs investigation. So
settings up alerts for
#type="servicefabric-platform"
          payload.category=Health payload.healthState=3
is probably a
good idea.
Combining the knowledge we have gained from digging into our logs, we can build a Service Fabric cluster dashboard:
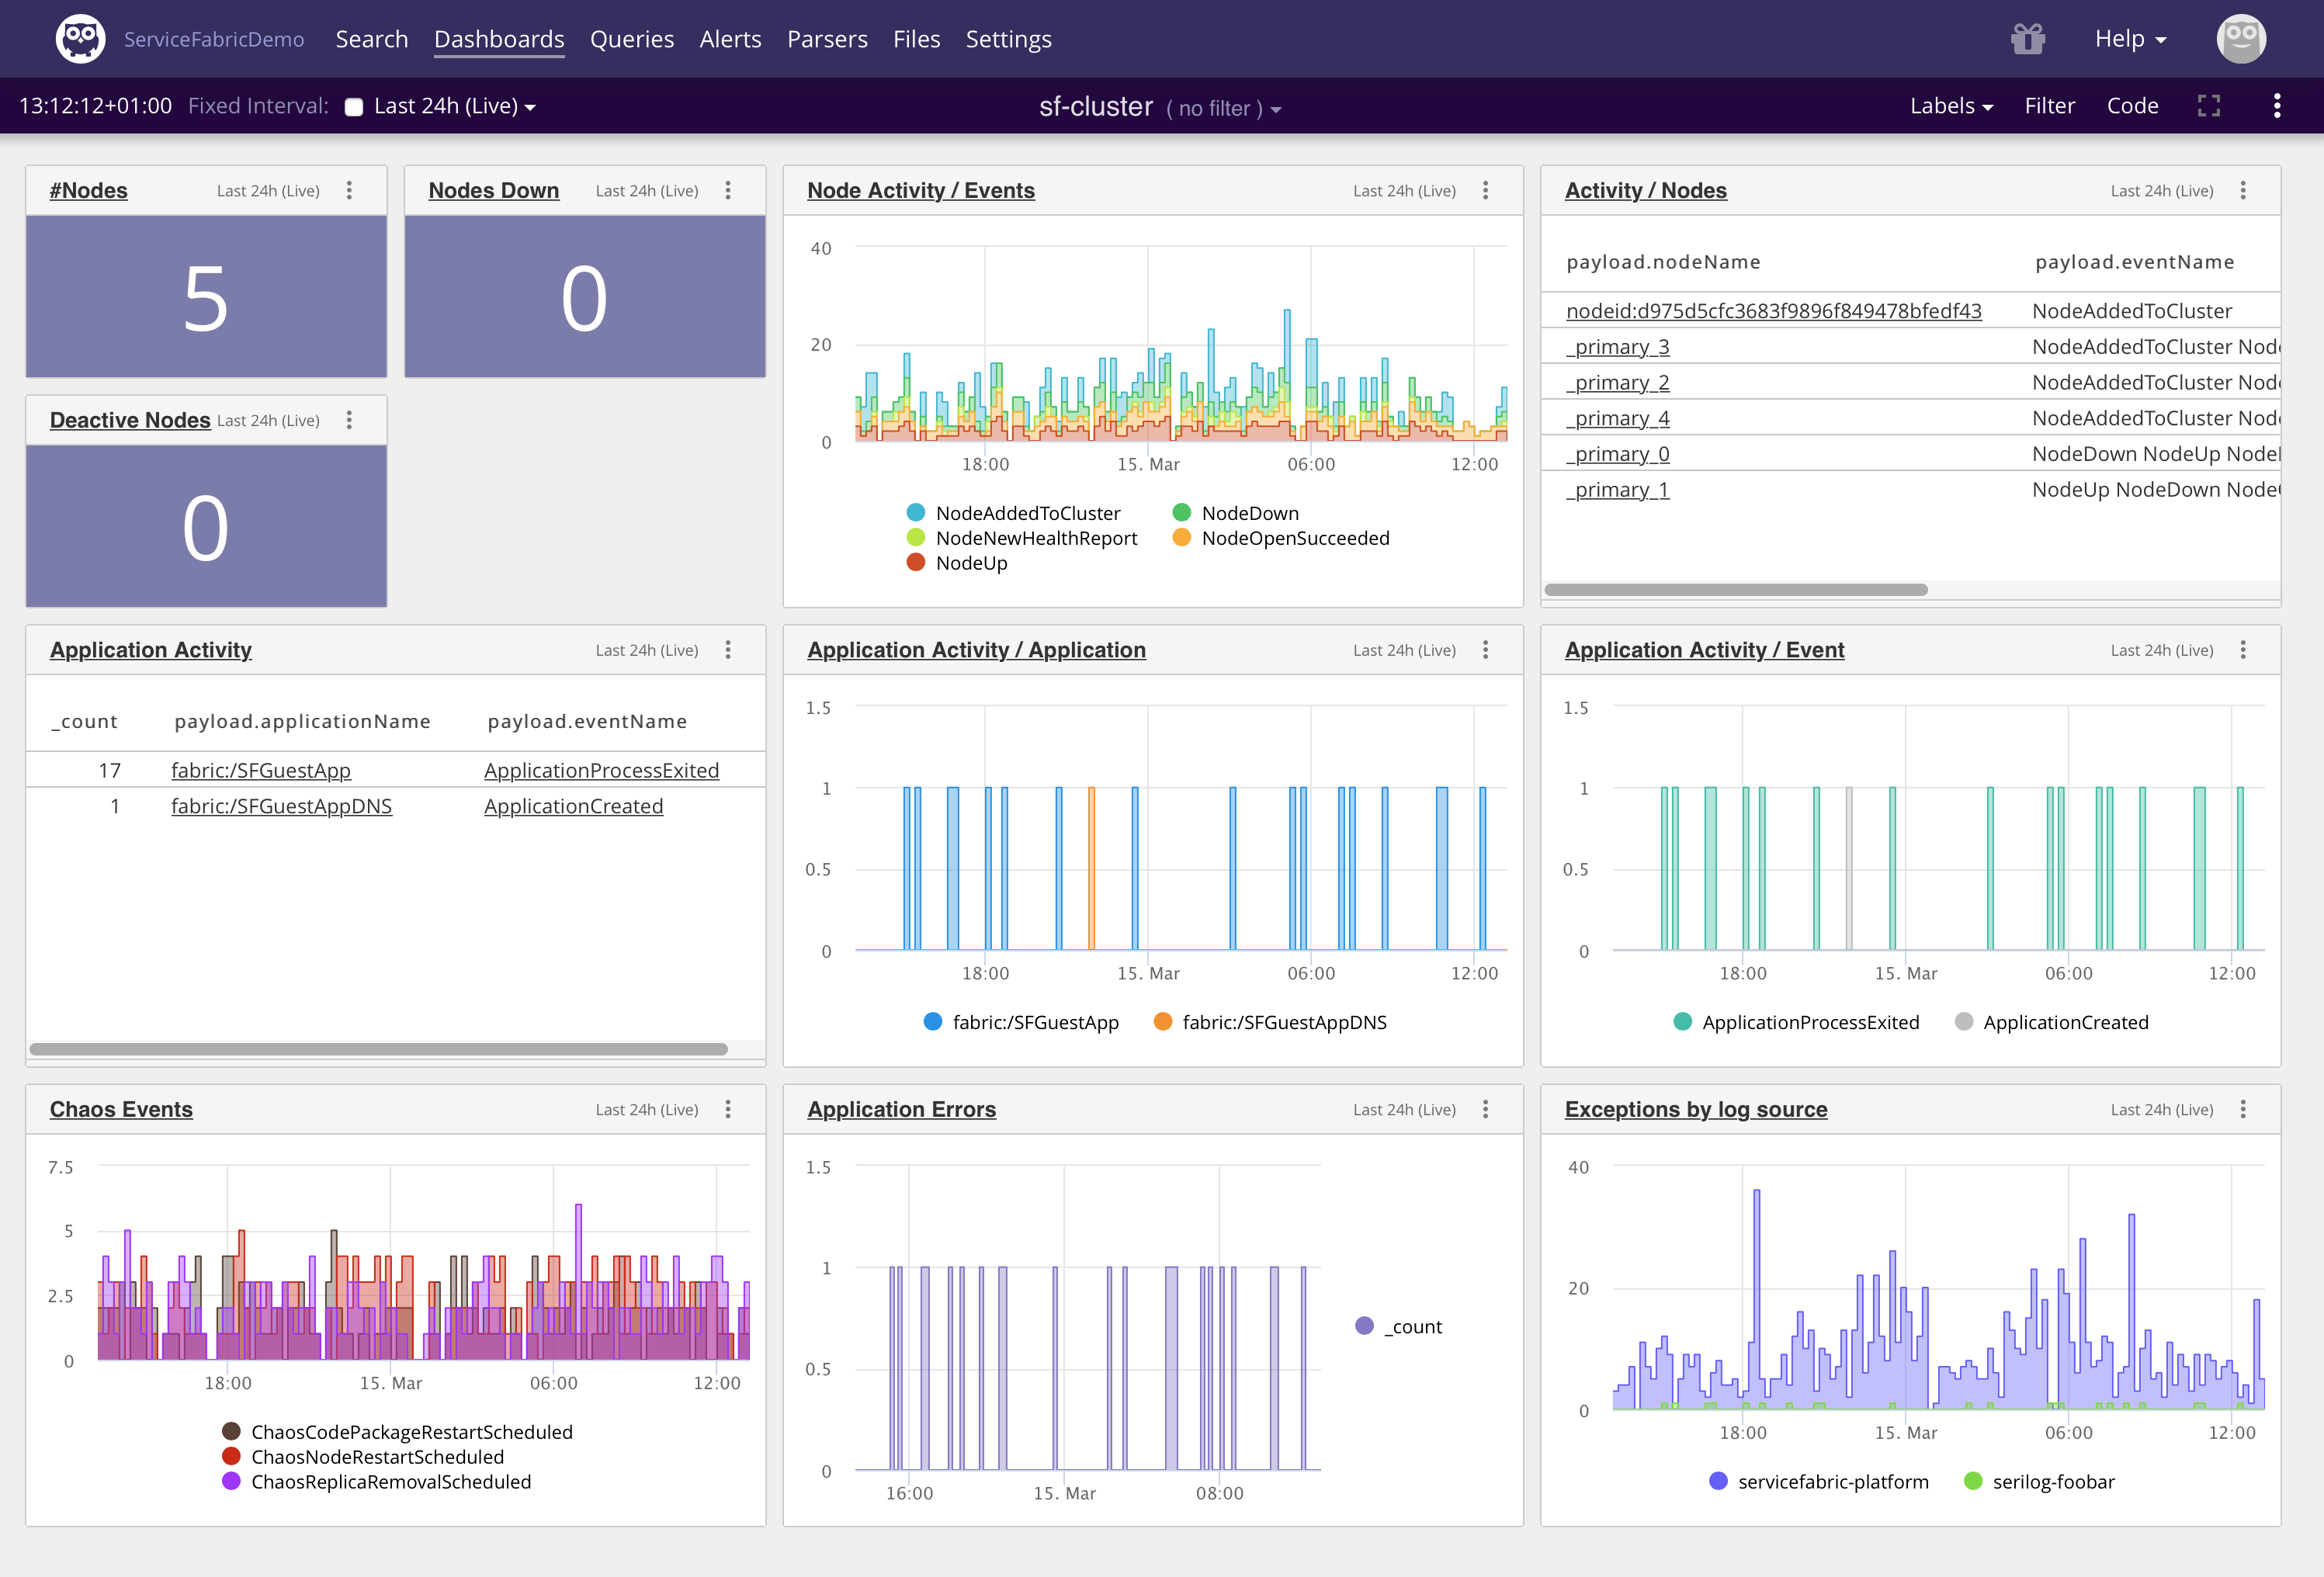 |
Figure 16. Cluster Dashboard