
Zscaler ZIA
Monitor Zscaler™ for suspicious activity more efficiently by correlating Zscaler™ events with other sources in LogScale.
Quickly find early indicators of attack or insider threats by looking at proxy traffic summaries per user, file downloads directly from an IP address and more.
Breaking Changes
This update includes parser changes, which means that data ingested after upgrade will not be backwards compatible with logs ingested with the previous version.
Updating to version 1.0.0 or newer will therefore result in issues with existing queries in for example dashboards or alerts created prior to this version.
See CrowdStrike Parsing Standard (CPS) 1.0 for more details on the new parser schema.
Installing the Package in LogScale
Find the repository where you want to send the Zscaler events, or Creating a Repository or View.
Navigate to your repository in the LogScale interface, click Settings and then on the left.
Click and install the LogScale package for Zscaler (i.e. zscaler/zia).
When the package has finished installing, click on the left (still under the , see Figure 98, “Ingest Token”).
In the right panel, click to create a new token. Give the token an appropriate name (e.g. the name of the Event Hub it will collect logs from), and assign the parser that was installed with the package zscaler.
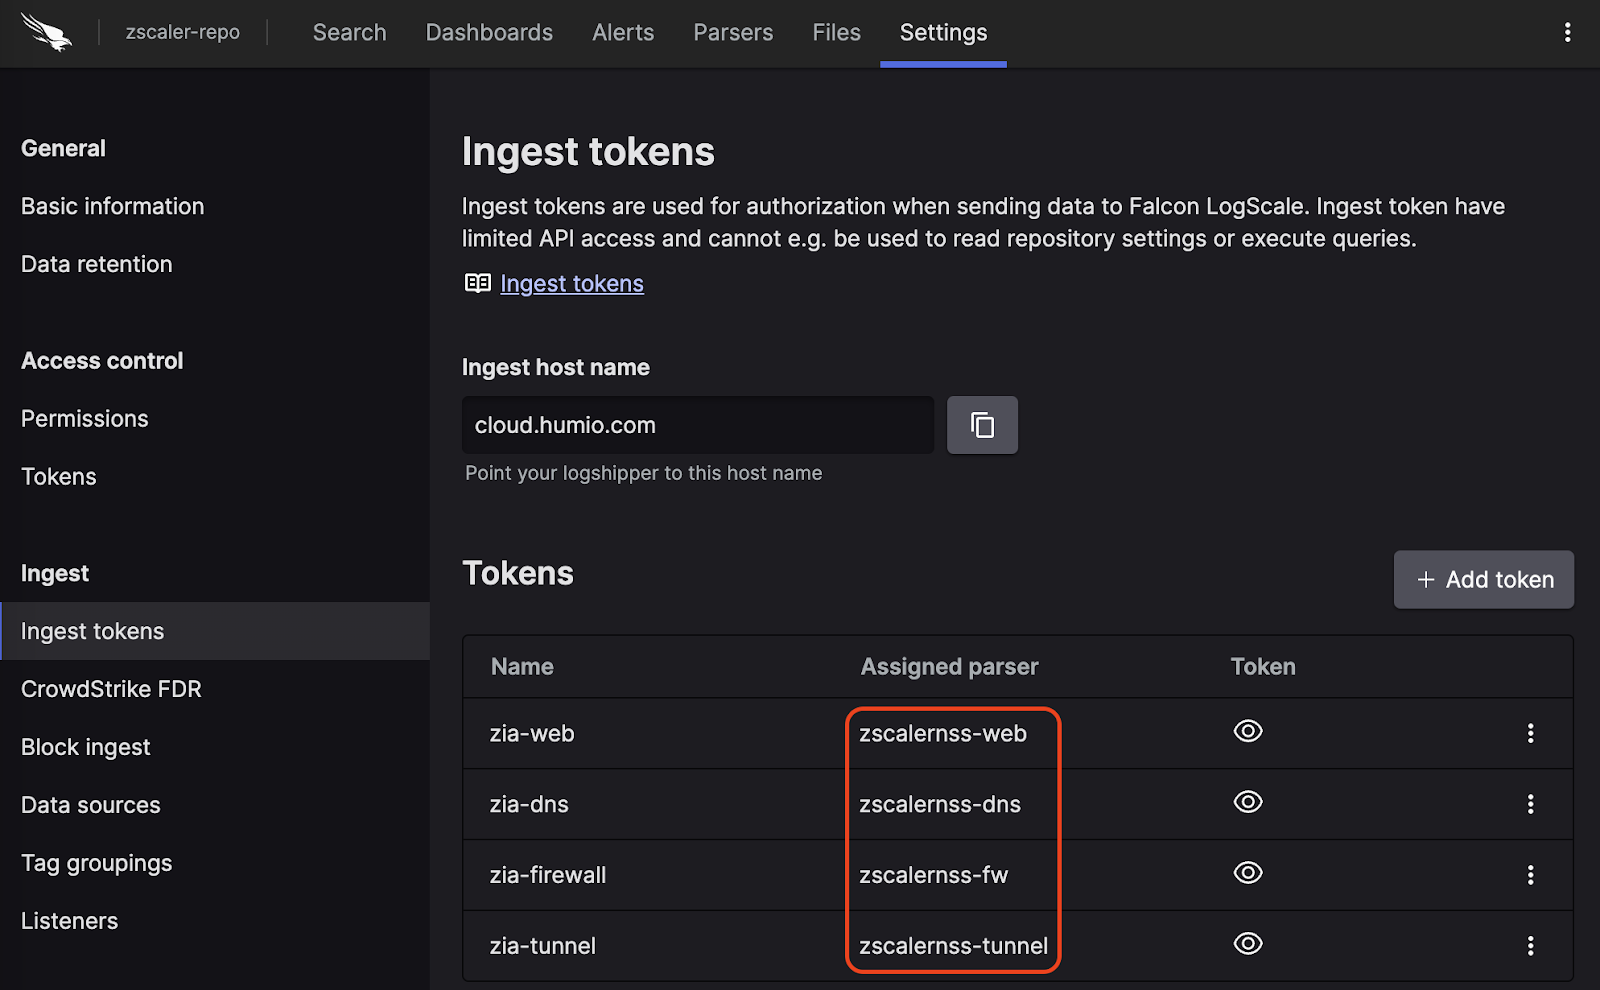
Figure 98. Ingest Token
Before leaving this page, view the ingest token and copy it to your clipboard — to save it temporarily elsewhere.
Now that you have a repository set up in LogScale along with an ingest token you're ready to send logs to LogScale.
Configurations and Sending the Logs to LogScale
To get logs from Zscaler ZIA into LogScale, you can use Zscaler Nanolog Streaming Service (NSS), which comes in two variants:
Cloud NSS, which allows you to send logs directly to LogScale
VM-based NSS, which allows you to collect logs on a VM, where they can be sent to LogScale via syslog
Cloud NSS
Configure the NSS feeds as follows:
Set as "Other"
Set the API URL as the URL for your LogScale cluster with the text
/api/v1/ingest/hec/rawappended, to point to the ingest API.Add a HTTP header, so that
Key1has the text Authorization andValue1has the valueBearer TOKENwhere the token is the ingest token for your given feed.If you are making a Web feed, then use the token that you assigned the zscalernss-web parser to in the previous step, and likewise for the other types.
Select as the Feed Output Type, and copy the given format for your feed type from the sections below.
In the list, enter these characters: ",\ (that is: double quote, comma, backslash)
VM-Based NSS
For VM-based NSS, you need the following:
NSS servers up and running.
A Falcon LogScale Log Collector that is accessible from the NSS server, and configured to receive syslog events over TCP, and forwarding them to LogScale. You can find an example syslog configuration in Sources & Examples for the log collector handling syslog in the library.
For the feed configuration inside NSS, or SIEM Destination Type, select .
For SIEM IP Address and SIEM TCP Port, insert the IP address and port where your log collector is listening for data.
For the Feed Output Type, select and copy the given format for your feed type from the sections below.
In the Feed Escape Character list, enter these characters: ",\ (that is: double quote, comma, backslash)
Note
You can add any fields you would like to these formats, and they will be present and usable in LogScale, but they will only be mapped to the schema if you manually extend the parsers to handle those fields.
DNS
DNS configuration:
\{"time":"%s{time}","elogin":"%s{elogin}","edepartment":"%s{edepartment}","elocation":"%s{elocation}","reqaction":"%s{reqaction}","resaction":"%s{resaction}","reqrulelabel":"%s{reqrulelabel}","resrulelabel":"%s{resrulelabel}","reqtype":"%s{reqtype}","req":"%s{req}","res":"%s{res}","sport":"%d{sport}","durationms":"%d{durationms}","cip":"%s{cip}","sip":"%s{sip}","domcat":"%s{domcat}","deviceowner":"%s{deviceowner}","devicehostname":"%s{devicehostname}"\}Firewall
Firewall configuration:
\{"time":"%s{time}","elogin":"%s{elogin}","edepartment":"%s{edepartment}","elocation":"%s{elocation}","cdport":"%d{cdport}","csport":"%d{csport}","sdport":"%d{sdport}","ssport":"%d{ssport}","csip":"%s{csip}","cdip":"%s{cdip}","ssip":"%s{ssip}","sdip":"%s{sdip}","tsip":"%s{tsip}","tsport":"%d{tsport}","ttype":"%s{ttype}","action":"%s{action}","dnat":"%s{dnat}","stateful":"%s{stateful}","aggregate":"%s{aggregate}","nwsvc":"%s{nwsvc}","nwapp":"%s{nwapp}","ipproto":"%s{ipproto}","ipcat":"%s{ipcat}","destcountry":"%s{destcountry}","avgduration":"%d{avgduration}","erulelabel":"%s{erulelabel}","inbytes":"%ld{inbytes}","outbytes":"%ld{outbytes}","duration":"%d{duration}","durationms":"%d{durationms}","numsessions":"%d{numsessions}","ipsrulelabel":"%s{ipsrulelabel}","threatcat":"%s{threatcat}","ethreatname":"%s{ethreatname}","deviceowner":"%s{deviceowner}","devicehostname":"%s{devicehostname}"\}Web
Web configuration:
\{"time":"%s{time}","login":"%s{login}","proto":"%s{proto}","eurl":"%s{eurl}","action":"%s{action}","appname":"%s{appname}","appclass":"%s{appclass}","reqsize":"%d{reqsize}","respsize":"%d{respsize}","stime":"%d{stime}","ctime":"%d{ctime}","urlclass":"%s{urlclass}","urlsupercat":"%s{urlsupercat}","urlcat":"%s{urlcat}","malwarecat":"%s{malwarecat}","threatname":"%s{threatname}","riskscore":"%d{riskscore}","dlpeng":"%s{dlpeng}","dlpdict":"%s{dlpdict}","location":"%s{location}","dept":"%s{dept}","cip":"%s{cip}","sip":"%s{sip}","reqmethod":"%s{reqmethod}","respcode":"%s{respcode}","eua":"%s{eua}","ereferer":"%s{ereferer}","ruletype":"%s{ruletype}","rulelabel":"%s{rulelabel}","contenttype":"%s{contenttype}","unscannabletype":"%s{unscannabletype}","deviceowner":"%s{deviceowner}","devicehostname":"%s{devicehostname}"\}Tunnel
Tunnel events have multiple possible event types, which each have their own formats. Configure them as follows:
Tunnel Events :
\{"datetime":"%s{datetime}","tunnelactionname":"%s{tunnelactionname}","tunneltype":"%s{tunneltype}","vpncredentialname":"%s{vpncredentialname}","elocationname":"%s{elocationname}","sourceip":"%s{sourceip}","destvip":"%s{destvip}","srcport":"%d{srcport}","event":"%s{event}","eventreason":"%s{eventreason}","recordid":"%d{recordid}"\}Tunnel Samples :
\{"datetime":"%s{datetime}","tunnelactionname":"%s{tunnelactionname}","tunneltype":"%s{tunneltype}","vpncredentialname":"%s{vpncredentialname}","elocationname":"%s{elocationname}","sourceip":"%s{sourceip}","destvip":"%s{destvip}","srcport":"%d{srcport}","txbytes":"%lu{txbytes}","rxbytes":"%lu{rxbytes}","dpdrec":"%d{dpdrec}","recordid":"%d{recordid}"\}IKE phase 1 :
\{"datetime":"%s{datetime}","recordtype":"%s{tunnelactionname}","tunneltype":"IPSEC IKEV %d{ikeversion}","vpncredentialname":"%s{vpncredentialname}","elocationname":"%s{elocationname}","sourceip":"%s{sourceip}","destvip":"%s{destvip}","srcport":"%d{srcport}","destinationport":"%d{dstport}","lifetime":"%d{lifetime}","ikeversion":"%d{ikeversion}","spi_in":"%lu{spi_in}","spi_out":"%lu{spi_out}","algo":"%s{algo}","authentication":"%s{authentication}","authtype":"%s{authtype}","recordid":"%d{recordid}"\}IKE phase 2 :
\{"datetime":"%s{datetime}","tunnelactionname":"%s{tunnelactionname}","tunneltype":"IPSEC IKEV %d{ikeversion}","vpncredentialname":"%s{vpncredentialname}","elocationname":"%s{elocationname}","sourceip":"%s{sourceip}","destvip":"%s{destvip}","srcport":"%d{srcport}","srcportstart":"%d{srcportstart}","destinationpordestportstarttstart":"%d{destportstart}","srcipstart":"%s{srcipstart}","srcipend":"%s{srcipend}","destipstart":"%s{destipstart}","destipend":"%s{destipend}","lifetime":"%d{lifetime}","ikeversion":"%d{ikeversion}","lifebytes":"%d{lifebytes}","spi":"%d{spi}","algo":"%s{algo}","authentication":"%s{authentication}","authtype":"%s{authtype}","protocol":"%s{protocol}","tunnelprotocol":"%s{tunnelprotocol}","policydirection":"%s{policydirection}","recordid":"%d{recordid}"\}Verify Data is Arriving in LogScale
Once you have completed the above steps the ZIA logs should be arriving in your LogScale repository.
You can verify this by doing a simple search for #Vendor :=
"zscaler" | #event.module := "zia" to see the events.
Package Contents Explained
This package is only for parsing incoming data, and normalizing the data as part of that parsing. The parser normalizes the data to a subset of this schema based on OpenTelemetry standards, while still preserving the original data.
If you want to search using the original field names and values, you can access those in the fields whose names are prefixed with the word "Vendor". Fields which are not prefixed with "Vendor" are standard fields which are either based on the schema (e.g. source.ip) or on LogScale conventions (e.g. @rawstring).
The fields which the parser currently maps the data to, are chosen based on what seems the most relevant, and will potentially be expanded in the future. But the parser won't necessarily normalize every field that has potential to be normalized.
Event Categorisation
As part of the schema, events are categorized by the following fields:
event.kind
event.category
event.type
event.kind can be searched as normal fields, but event.category and event.type are arrays, so need to be searched like so:
array:contains("event.category[]", value="network")
This will find events where some
"event.category[n]" field contains the value
"network", regardless of what
n is.
Note that not all events will be categorized to this level of detail.
Normalized Fields
Here are some of the normalized fields which are being set by this parser:
client.* (e.g client.port)
destination.* (e.g destination.domain, destination.ip, destination.bytes, destination.port, destination.geo.country_name)
ecs.* (e.g ecs.version)
file.* (e.g file.type, file.hash.md, file.extension, file.name)
event.* (e.g event.action, event.category, event.dataset, event.kind, event.module, event.reason, event.risk_score, event.type, event.id)
host.* (e.g host.name, host.hostname)
http.* (e.g http.request.bytes, http.request.method, http.request.mime_type, http.request.referrer, http.response.bytes, http.response.status_code)
network.* (e.g network.protocol, network.transport, network.application)
rule.* (e.g rule.name, rule.ruleset)
source.* (e.g source.nat.ip, source.ip, source.bytes, source.packets, source.port)
user.* (e.g user.name, user.email, user.domain)
user_agent.* (e.g user_agent.original)
dns.* (e.g dns.question.type, dns.answers.name, dns.question.name)
Example Queries
To see only data from one of the feeds, you can search with the query:
#event.dataset = "zia.web"Which only returns the data that was parsed with the parser for web events (and similarly for the other feed types and their parsers).
To see where your traffic is headed, you can search for:
worldMap(ip=destination.ip)