

Okta SSO
This package provides a parser for Okta events in JSON format.
Breaking Changes
This update includes parser changes, which means that data ingested after upgrade will not be backwards compatible with logs ingested with the previous version.
Updating to version 1.0.0 or newer will therefore result in issues with existing queries in for example dashboards or alerts created prior to this version.
See CrowdStrike Parsing Standard (CPS) 1.0 for more details on the new parser schema.
Follow the CPS Migration to update your queries to use the fields and tags that are available in data parsed with version 1.0.0.
Installing the Package in LogScale
Find the repository where you want to send the Okta events, or create a new one.
Navigate to your repository in the LogScale interface, click Settings and then on the left.
Click and install the LogScale package for Okta SSO (i.e. okta/sso).
When the package has finished installing, click on the left (still under the , see Figure 51, “Ingest Token”). See Ingest Tokens for more information on ingest tokens.
In the right panel, click to create a new token. Give the token an appropriate name (e.g. the name of the server the token is ingesting logs for), and assign the
okta-ssoparser to it or leave the parser unassigned if you intend to assign the parser separately, for example during the LogScale Collector configuration phase.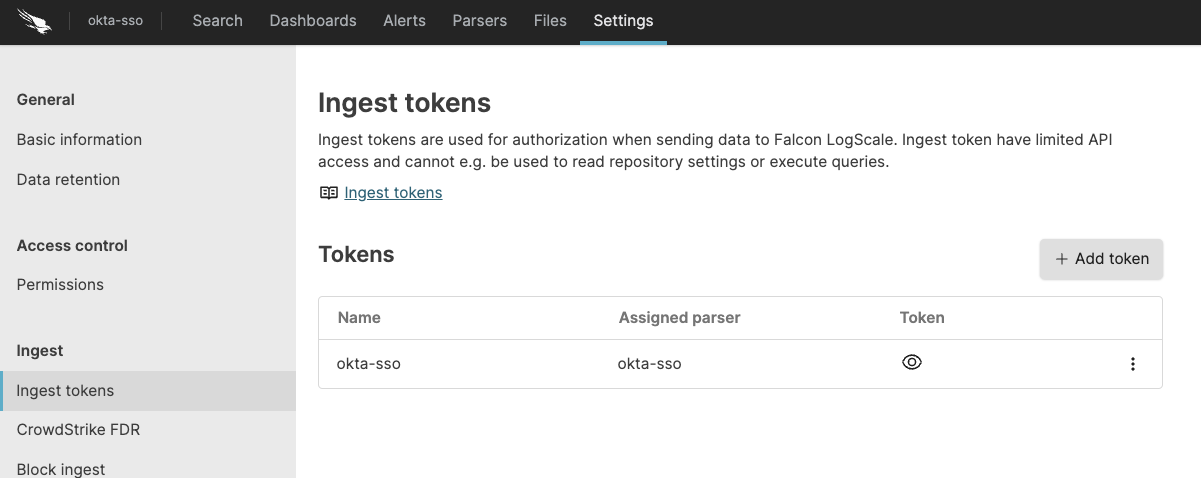
Figure 51. Ingest Token
Before leaving this page, view the ingest token and copy it to your clipboard — to save it temporarily elsewhere.
Now that you have a repository set up in LogScale along with an ingest token you're ready to send logs to LogScale.
Configurations and sending the logs to LogScale
First you need to configure the Okta Log Streaming™ to send the events to AWS EventBridge™. For that, in the OKTA Administration Console navigate to Reports then Log Streaming where you will be given an option to add feeds. Configure a feed to send all Okta events to Falcon LogScale.
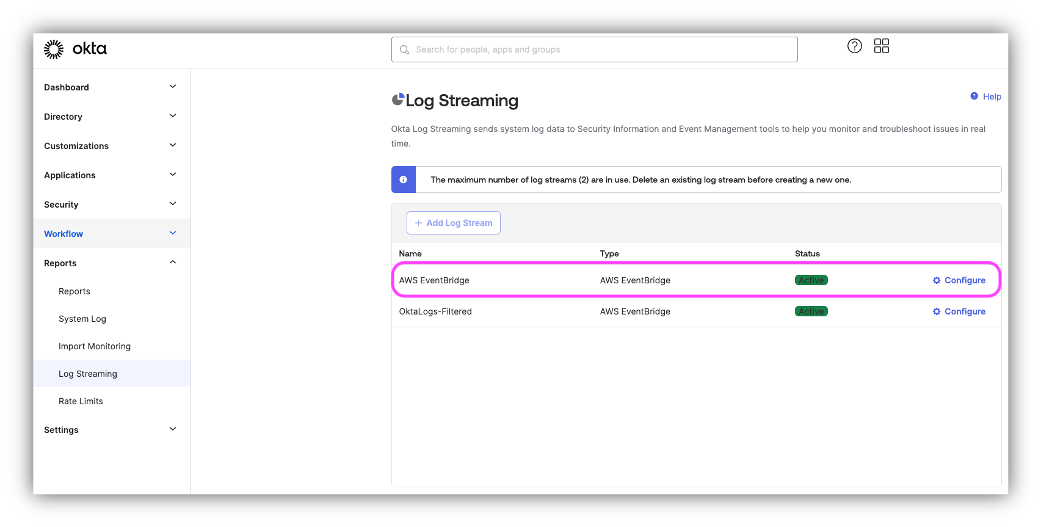 |
Figure 52. Feeds
To complete the Log Stream configuration specify the event source name and AWS details, like; AWS account id and region:
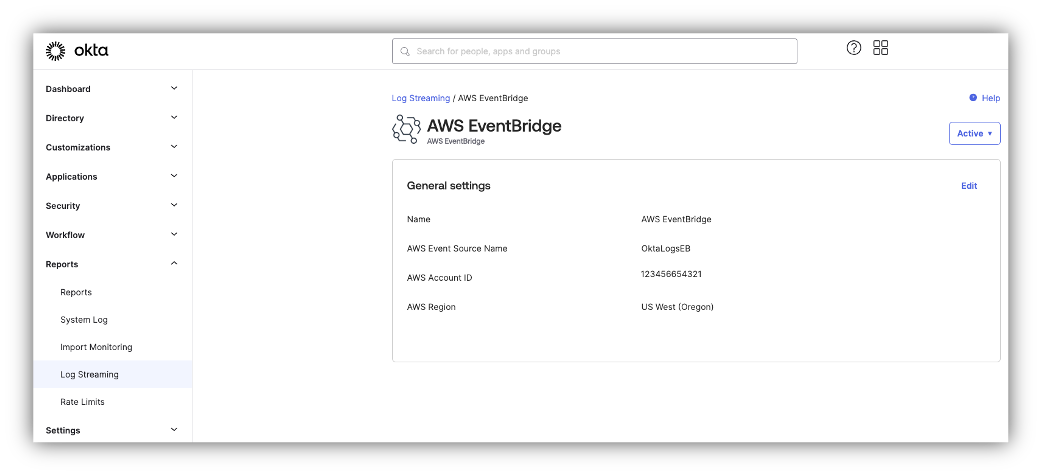
Figure 53. AWS EventBridge
Once you've completed the configuration in Okta, login to the AWS Console to verify that the feed was created. Navigate to Amazon EventBridge™ and click to see details. As shown in the screen-shot below the feed was successfully created:
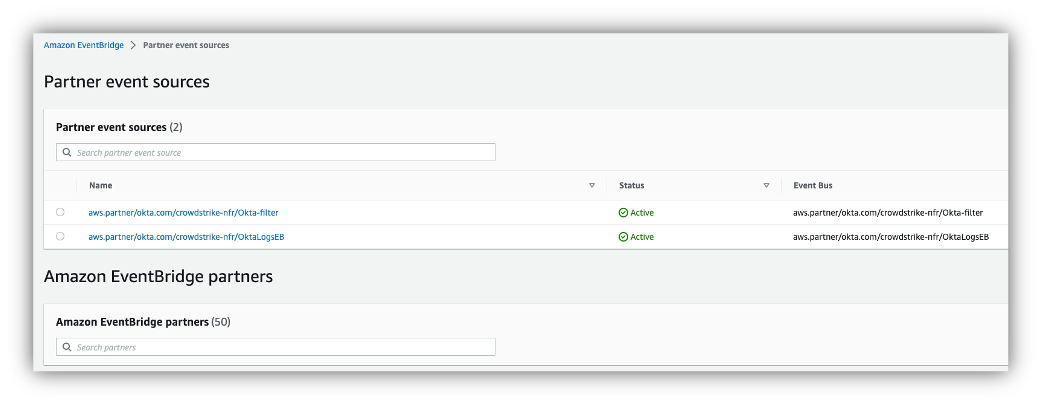
Figure 54. Partner event sources
In the next step we will configure the aws.partner/okta.com/crowdstrike-nfr/OktaLogsEB Partner Event Source to send all Okta log events to the LogScale. Click in the left navigation panel of the Amazon EventBridge™.
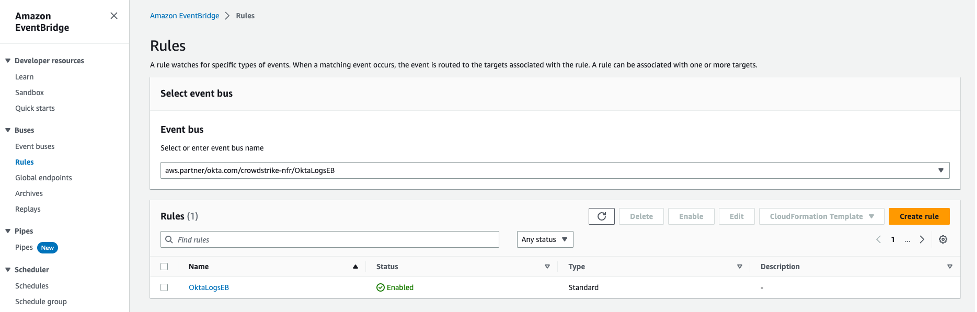
Figure 55. Rules
Create a Rule for our Event bus and name it. In the tab, add the JSON formatted Event Pattern matching Okta Log Stream events for all events:
{ "source": [{"prefix": "aws.partner/okta.com"}], }Click here to read more about event patterns.
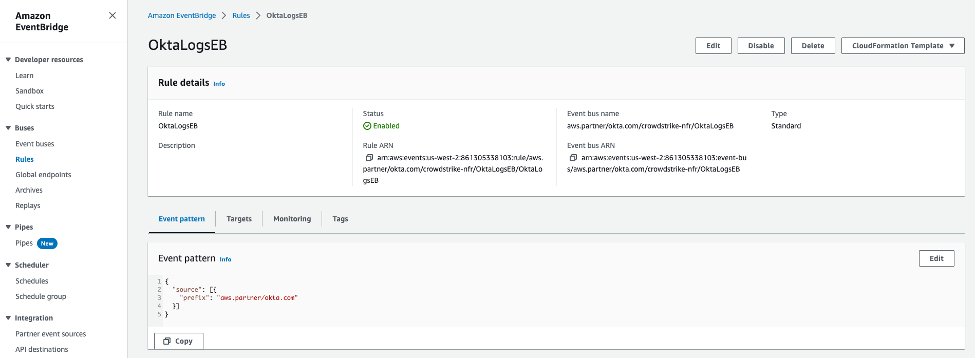
Figure 56. Event patterns
The final step is to configure the API destination for the LogScale cluster. Click on the button under the API Destinations of the Amazon EventBridge™.
Specify:
Name, for example: LogScaleSACluster
API destination endpoint in format
https://<your-logscale-cluster>/api/v1/ingest/raw/<ingest-token>Where: <your-logscale-cluster> needs to be a valid FQDN of your LogScale instance and <ingest-token> is Ingest Tokens the assigned to the okta-sso parser.
For example: https://sa-cluster.humio-support.com/api/v1/ingest/raw/4264f1f1-919f-4eed-a53d-1234567
HTTP method - select POST
Connection, select create a new one where you must:
Insert a name which helps you to identify the connection.
Set the authorization type to API Key and paste the ingest token for your repository, see Ingest Tokens for more information on ingest tokens.
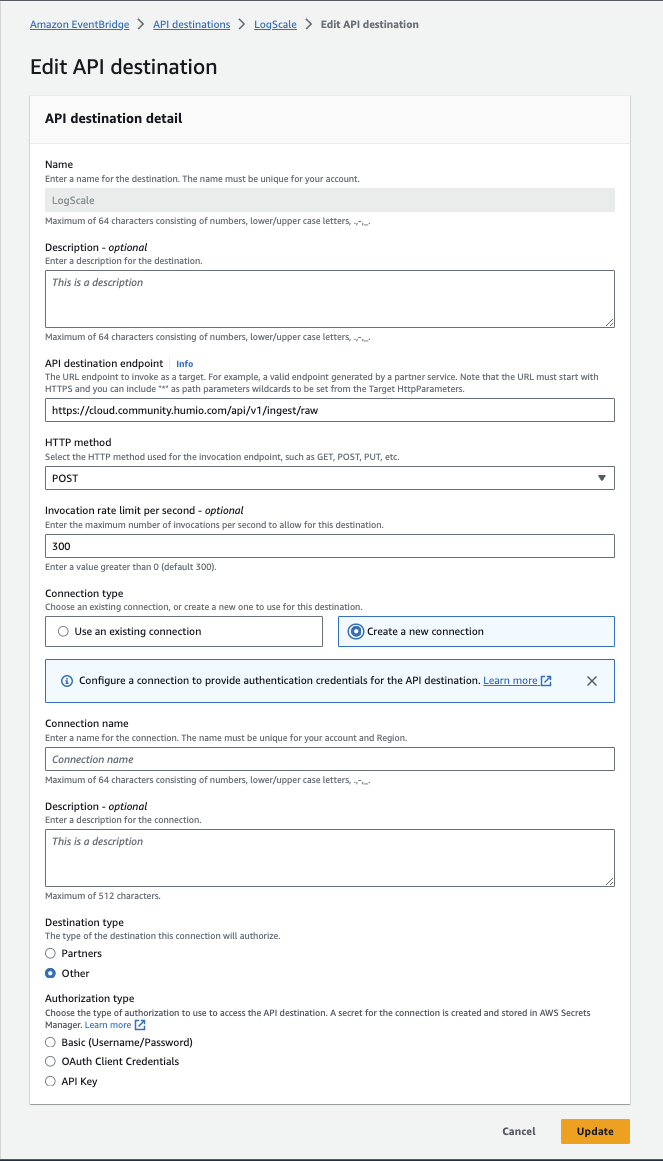
Figure 57. Create Connection
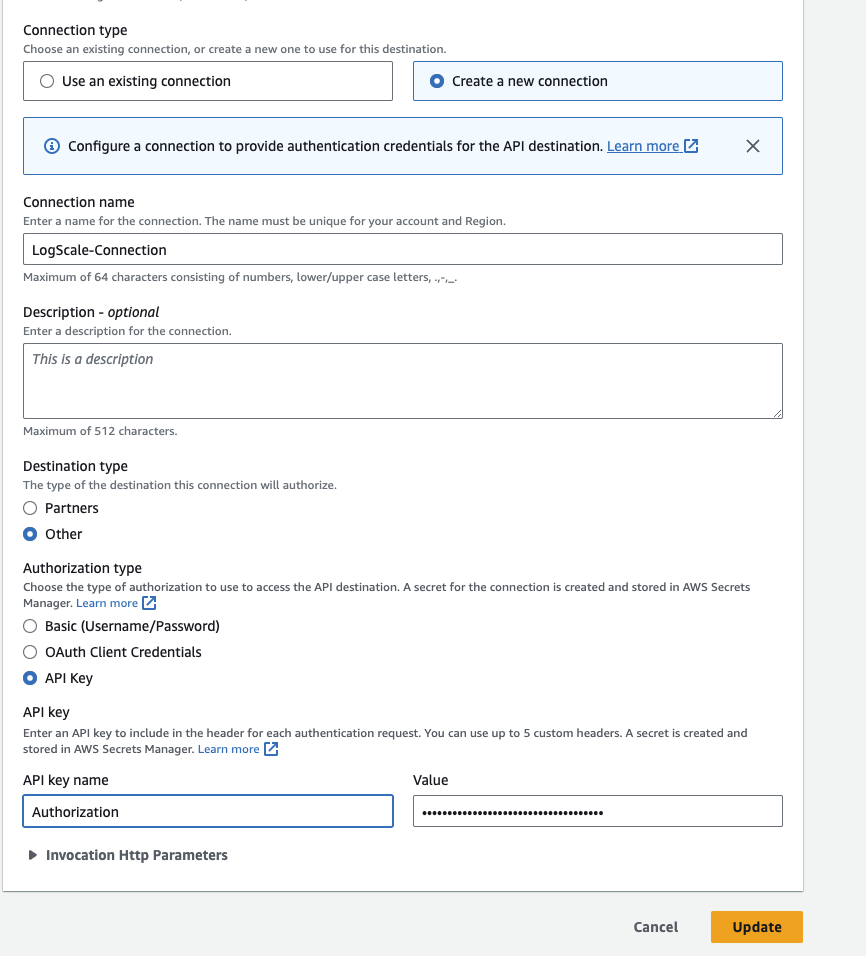
Figure 58. Create Connection Details
Set the Target of your Rule to the API Destination of your LogScale instance
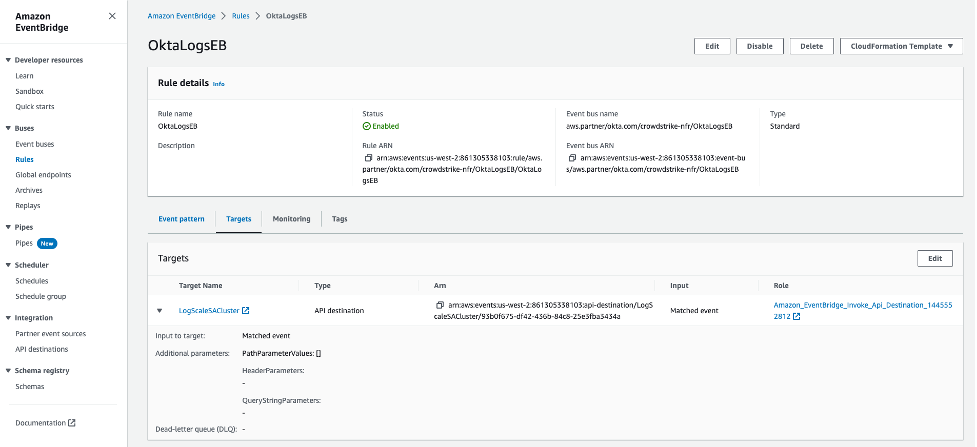
Figure 59. Okta Logs EB
Verify Data is Arriving in LogScale
Once you have completed the above steps the Okta SSO data should be arriving in your LogScale repository.
You can verify this by doing a simple search for Vendor
= "okta" | #event.module = "sso"
Package Contents Explained
This package parses incoming data, and normalizing the data as part of that parsing. The parser normalizes the data to CrowdStrike Parsing Standard (CPS) 1.0 schema based on OpenTelemetry standards, while still preserving the original data.
If you want to search using the original field names and values, you can access those in the fields whose names are prefixed with the word "Vendor". Fields which are not prefixed with "Vendor" are standard fields which are either based on the schema (e.g. source.ip) or on LogScale conventions (e.g. @rawstring).
The fields which the parser currently maps the data to, are chosen based on what seems the most relevant, and will potentially be expanded in the future. But the parser won't necessarily normalize every field that has potential to be normalized.
Event Categorisation
As part of the schema, events are categorized by four different fields:
event.category
event.type
event.kind
#event.outcome
(#event.outcome is a tag, hence the "#")
event.kind and #event.outcome can be searched as normal fields, but event.category and event.type are arrays, so need to be searched like so:
array:contains("event.category[]", value="api")
This will find events where some
event.category[n] field contains the value
api, regardless of what n
is.
Note that not all events will be categorized to this level of detail.
Normalized Fields
Here are some of the normalized fields which are being set by this parser:
user.* (e.g. user.name, use.target.full_name)
source.* (e.g. source.domain)
client.* (e.g. client.geo.city_name, client.domain)
Next Steps and Use Cases
You can get actionable insights from your Okta data by hunting for suspicious activity in LogScale using the search UI, dashboards or alerts.
Some specific example of suspicious activity is admin activity from multiple IP addresses within a few hours or from unexpected ASN / IP ranges. Another thing to keep an eye on is Okta MFA disablement.
You can set up a table showing it using the following query:
#Vendor = "okta"
| #event.module = "sso"
| IN(field=event.action, values=["user.mfa.factor.deactivate", system.mfa.factor.deactivate, user.mfa.factor.reset_all, user.mfa.factor.suspend])
| groupBy([user.name], function=([max(@timestamp, as=latest), min(@timestamp, as=earliest), collect([Vendor.outcome.reason, user.target.name, event.action, client.as.organization.name, client.ip, Vendor.displayMessage, user_agent.original]), count(user.name, as=count)]))
| formatTime("%Y/%m/%d %H:%M:%S", as=earliest, field=earliest, locale=en_US, timezone=Z)
| formatTime("%Y/%m/%d %H:%M:%S", as=latest, field=latest, locale=en_US, timezone=Z)
| format(format="%s %s", field=[client.ip, user.name], as="throttle")
| table([user.name, user.target.name, client.ip, user_agent.original, earliest, latest, Vendor.displayMessage, event.action, Vendor.outcome.reason, count, client.as.organization.name])
Also try
#Vendor = "okta"
| #event.module = "sso"
| (event.action = "core.user.impersonation.session.initiated" OR Vendor.legacyEventType="core.user.impersonation.session.initiated")
| NOT (user.name = *your_custom_domain_here)
| groupBy([source.user.name, user.target.name, Vendor.displayMessage, Vendor.authenticationContext.externalSessionId, @timestamp ])
| rename(Vendor.authenticationContext.externalSessionId, as=sessionID)