

Fortinet FortiGate
Monitor Fortinet™ FortiGate for suspicious activity more efficiently by correlating FortiGate logs with other sources in LogScale. Quickly find early indicators of attack such as failed admin login attempts, changes in firewall policies, higher amount of inbound blocked connections and more.
Breaking Changes
This update includes parser changes, which means that data ingested after upgrade will not be backwards compatible with logs ingested with the previous version.
Updating to version 1.0.0 or newer will therefore result in issues with existing queries in for example dashboards or alerts created prior to this version.
See CrowdStrike Parsing Standard (CPS) 1.0 for more details on the new parser schema.
Follow the CPS Migration to update your queries to use the fields and tags that are available in data parsed with version 1.0.0.
Installing the Package in LogScale
Find the repository where you want to send the FortiGate logs, or create a new one.
Navigate to your repository in the LogScale interface, click Settings and then on the left.
Click and install the LogScale package for FortiGate (i.e. fortinet/fortigate).
When the package has finished installing, click on the left still under the .
In the right panel, click to create a new token. Give the token an appropriate name (e.g. the name of the server the token is ingesting logs for), and either leave the parser unassigned (instead of setting the parser in the log collector configuration later on), or assign the
fortinet-fortigateparser to it.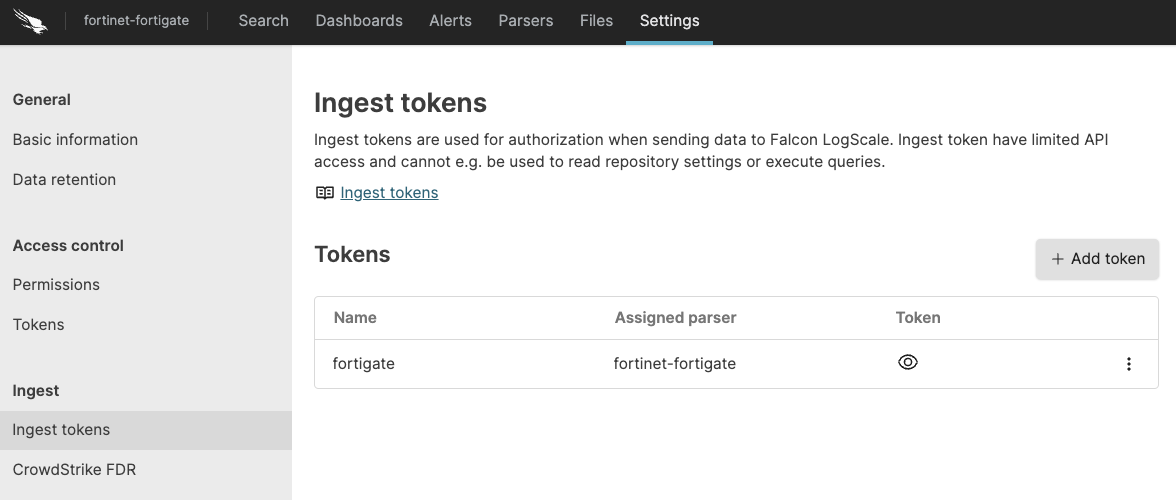
Figure 38. Ingest Token
Before leaving this page, view the ingest token and copy it to your clipboard — to save it temporarily elsewhere.
Now that you have a repository set up in LogScale along with an ingest token you're ready to send events to LogScale.
Configurations and Sending the logs to LogScale
First you need to configure FortiGate to send all logs types to the syslog server.
Next, configure the Falcon LogScale Collector to ship the logs from your syslog server into LogScale. Follow LogScale Collector Install LogScale Collector and Configure LogScale Collector. LogScale Collector documentation also provides an example of how you can configure your syslog datasource.
Verify Data is Arriving in LogScale
Once you have completed the above steps the fortinet data should be arriving in your LogScale repository.
You can verify this by doing a simple search for #Vendor =
"fortinet" | #event.module = "fortigate" to see the events.
Package Contents Explained
This package parses incoming data, and normalizing the data as part of that parsing. The parser normalizes the data to CrowdStrike Parsing Standard (CPS) 1.0 schema based on OpenTelemetry standards, while still preserving the original data.
If you want to search using the original field names and values, you can access those in the fields whose names are prefixed with the word "Vendor". Fields which are not prefixed with "Vendor" are standard fields which are either based on the schema (e.g. source.ip) or on LogScale conventions (e.g. @rawstring).
The fields which the parser currently maps the data to, are chosen based on what seems the most relevant, and will potentially be expanded in the future. But the parser won't necessarily normalize every field that has potential to be normalized.
Event Categorisation
As part of the schema, events are categorized by four different fields:
event.category
event.kind
event.type
#event.outcome
event.category is an array, so it needs to be searched like so:
array:contains("event.category[]", value="network")
Normalized Fields
Here are some of the normalized fields which are being set by this parser:
source.* (e.g. source.ip, source.mac, source.port)
file.* (e.g. file.size, file.name)
destination.* (e.g. destination.ip, destination.port)
network.* (e.g. network.packets, network.bytes)
observer.* (e.g. observer.vendor, observer.product)
related.* (e.g. related.ip, related.hosts, related.user)
Next steps and use cases
You can get actionable insights from your Fortigate data by hunting for suspicious activity in LogScale using the Searching Data, Dashboards & Widgets or Automation.