
Rubrik Security Cloud
This package provides a way to parse out operational logs and security events from Rubrik in Logscale. You can then create alerts from this data with threat detection logs based on Rubrik's ransomware detection and IOC scans.
The parser normalizes data to a common schema based on CrowdStrike Parsing Standard (CPS) 1.0. This schema allows you to search the data without knowing the data specifically, and just knowing the common schema instead. It also allows you to combine the data more easily with other data sources which conform to the same schema.
Breaking Changes
This update includes parser changes, which means that data ingested after upgrade will not be backwards compatible with logs ingested with the previous version.
Updating to version 1.0.0 or newer will therefore result in issues with existing queries in for example dashboards or alerts created prior to this version.
See CrowdStrike Parsing Standard (CPS) 1.0 for more details on the new parser schema.
Follow the CPS Migration to update your queries to use the fields and tags that are available in data parsed with version 1.0.0.
Installing the Package in LogScale
Find the repository where you want to send the Rubrik Security Cloud events, or Creating a Repository or View.
Navigate to your repository in the LogScale interface, click Settings and then on the left.
Click and install the LogScale package for Rubrik Security Cloud (i.e. rubrik/security-cloud).
When the package has finished installing, click on the left (still under the , see Ingest Tokens).
In the right panel, click to create a new token. Give the token an appropriate name, and assign the parser rubrik-json.
Before leaving this page, view the ingest token and copy it to your clipboard — to save it temporarily elsewhere.
Configurations and Sending the Logs to LogScale
You will need the ingest token you created and copied in the previous steps when you create a webhook in Rubrik, follow the steps defined in the Rubrik Documentation.
In Rubrik Security Cloud, navigate to → → and Select .
In the
Webhook configurationscreen,Select as the provider (select CrowdStrike Falcon Logscale if you see it - this option will be added in an upcoming release.)
Provide a name for the webhook.
Copy the Logscale endpoint, see LogScale URLs & Endpointsfor more information, from the Logscale UI followed by
/api/v1/ingest/hec/rawand paste it into the Endpoint field, for examplehttps://cloud.us.humio.com/api/v1/ingest/hec/raw.In the API Key field paste the LogScale ingest token which was created during installation of the package.
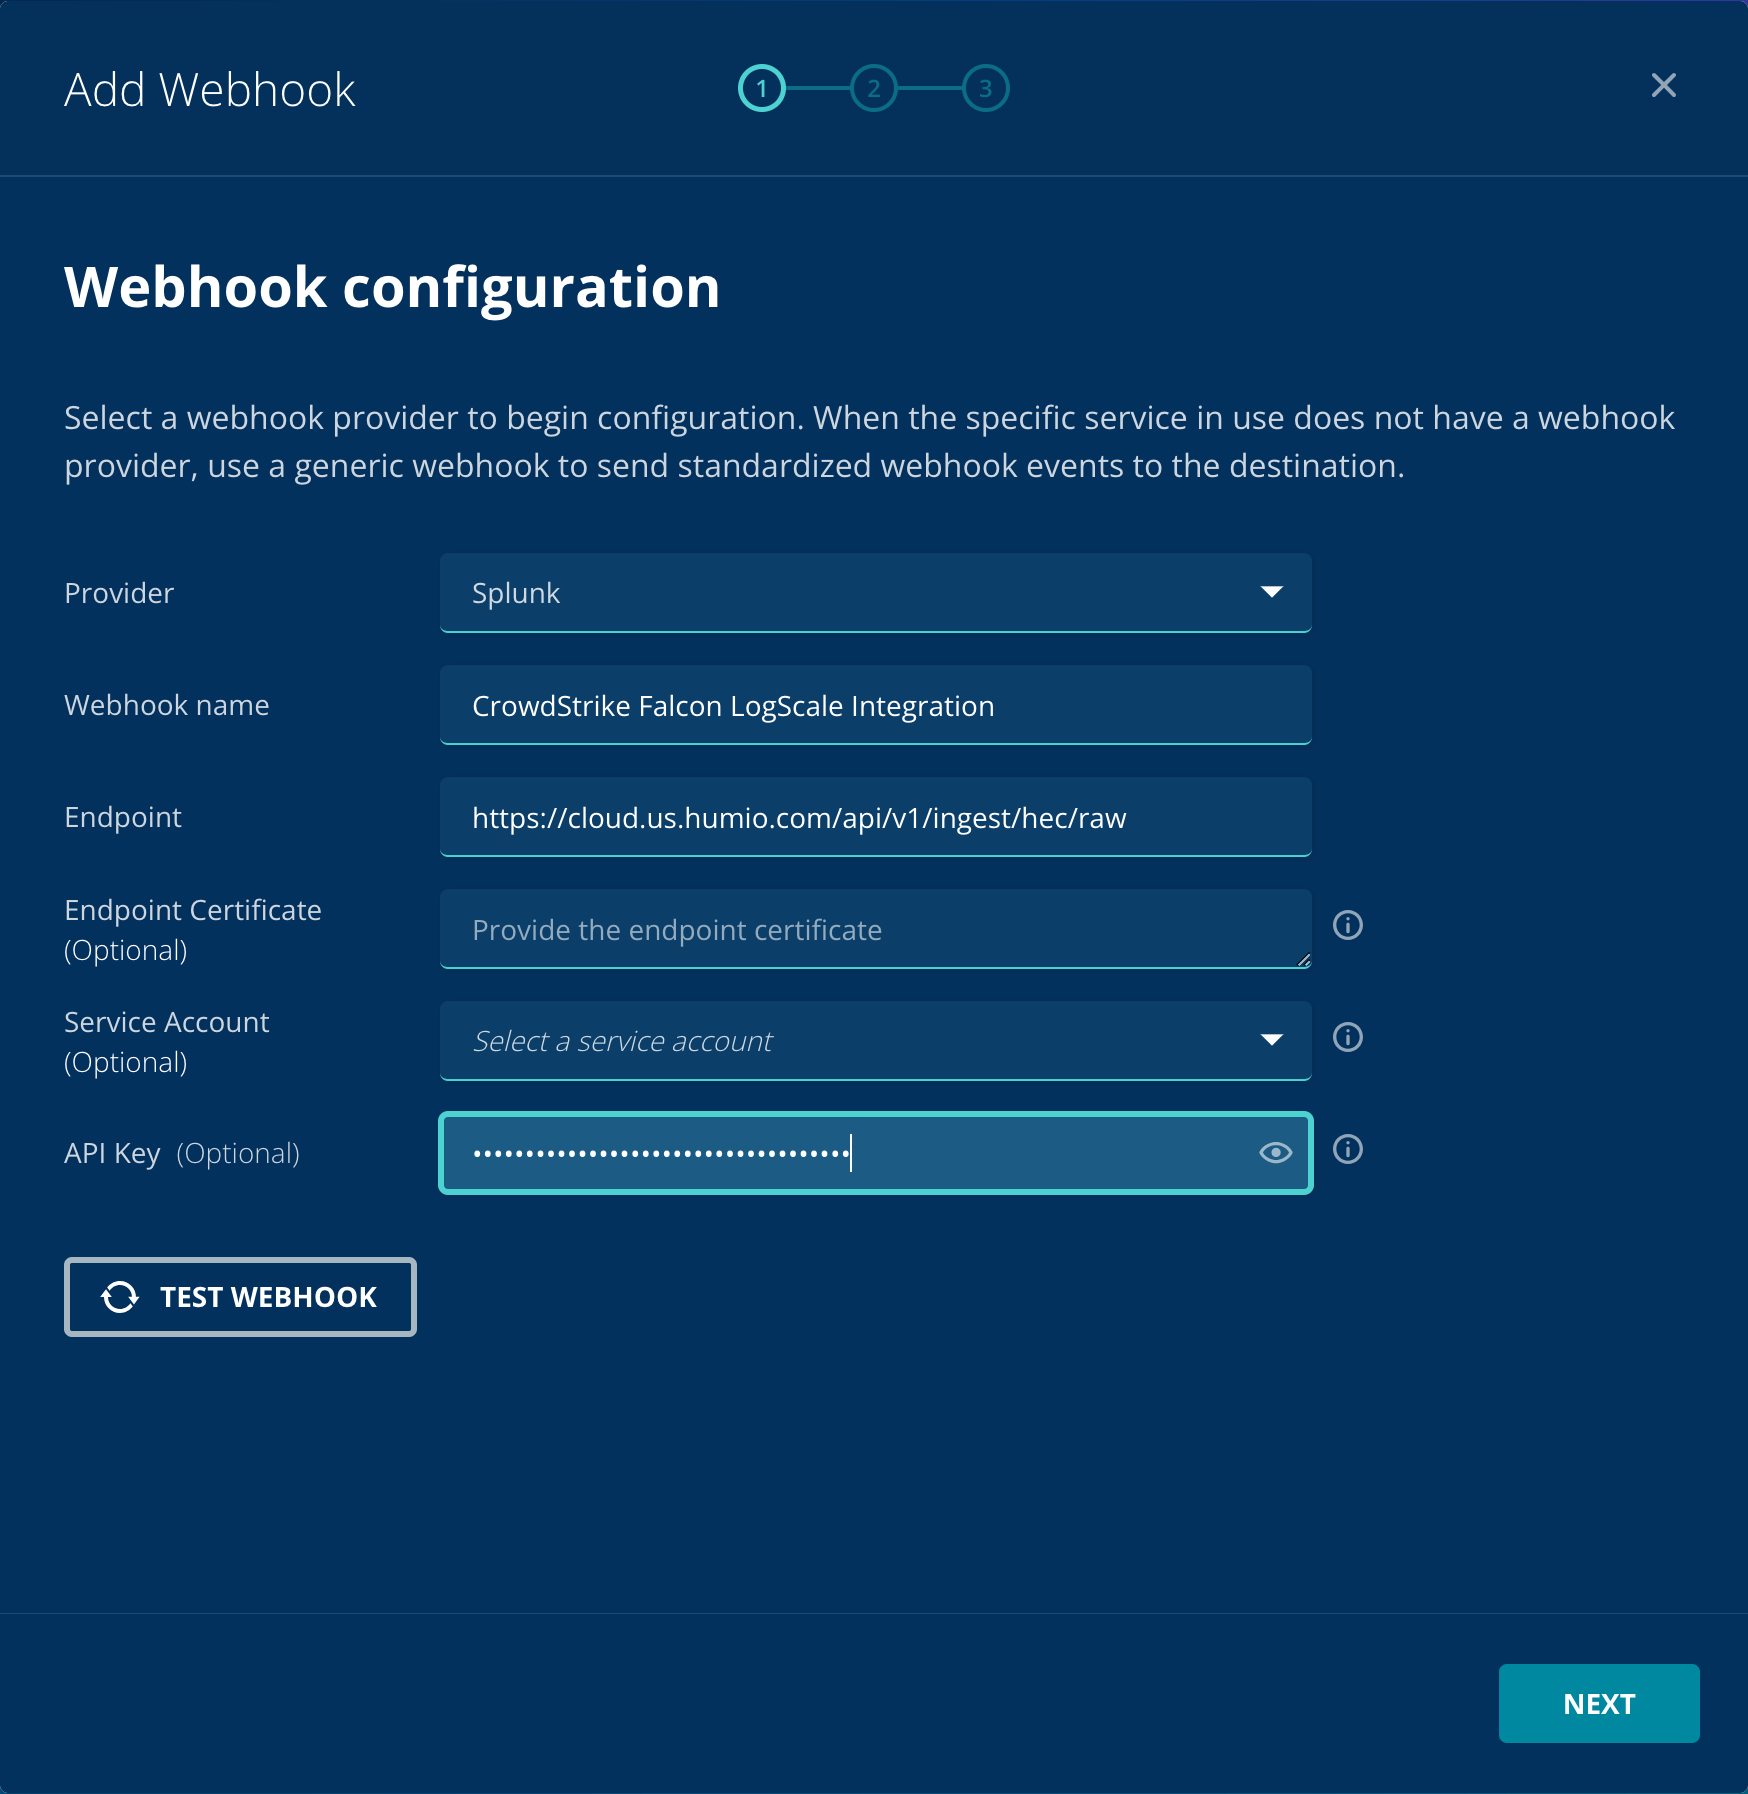
Figure 63. Webhook
Click to verify that the ingest token and URL are correct.
In Add Webhook Select event and severity screen, select all the events (you may need to scroll down).
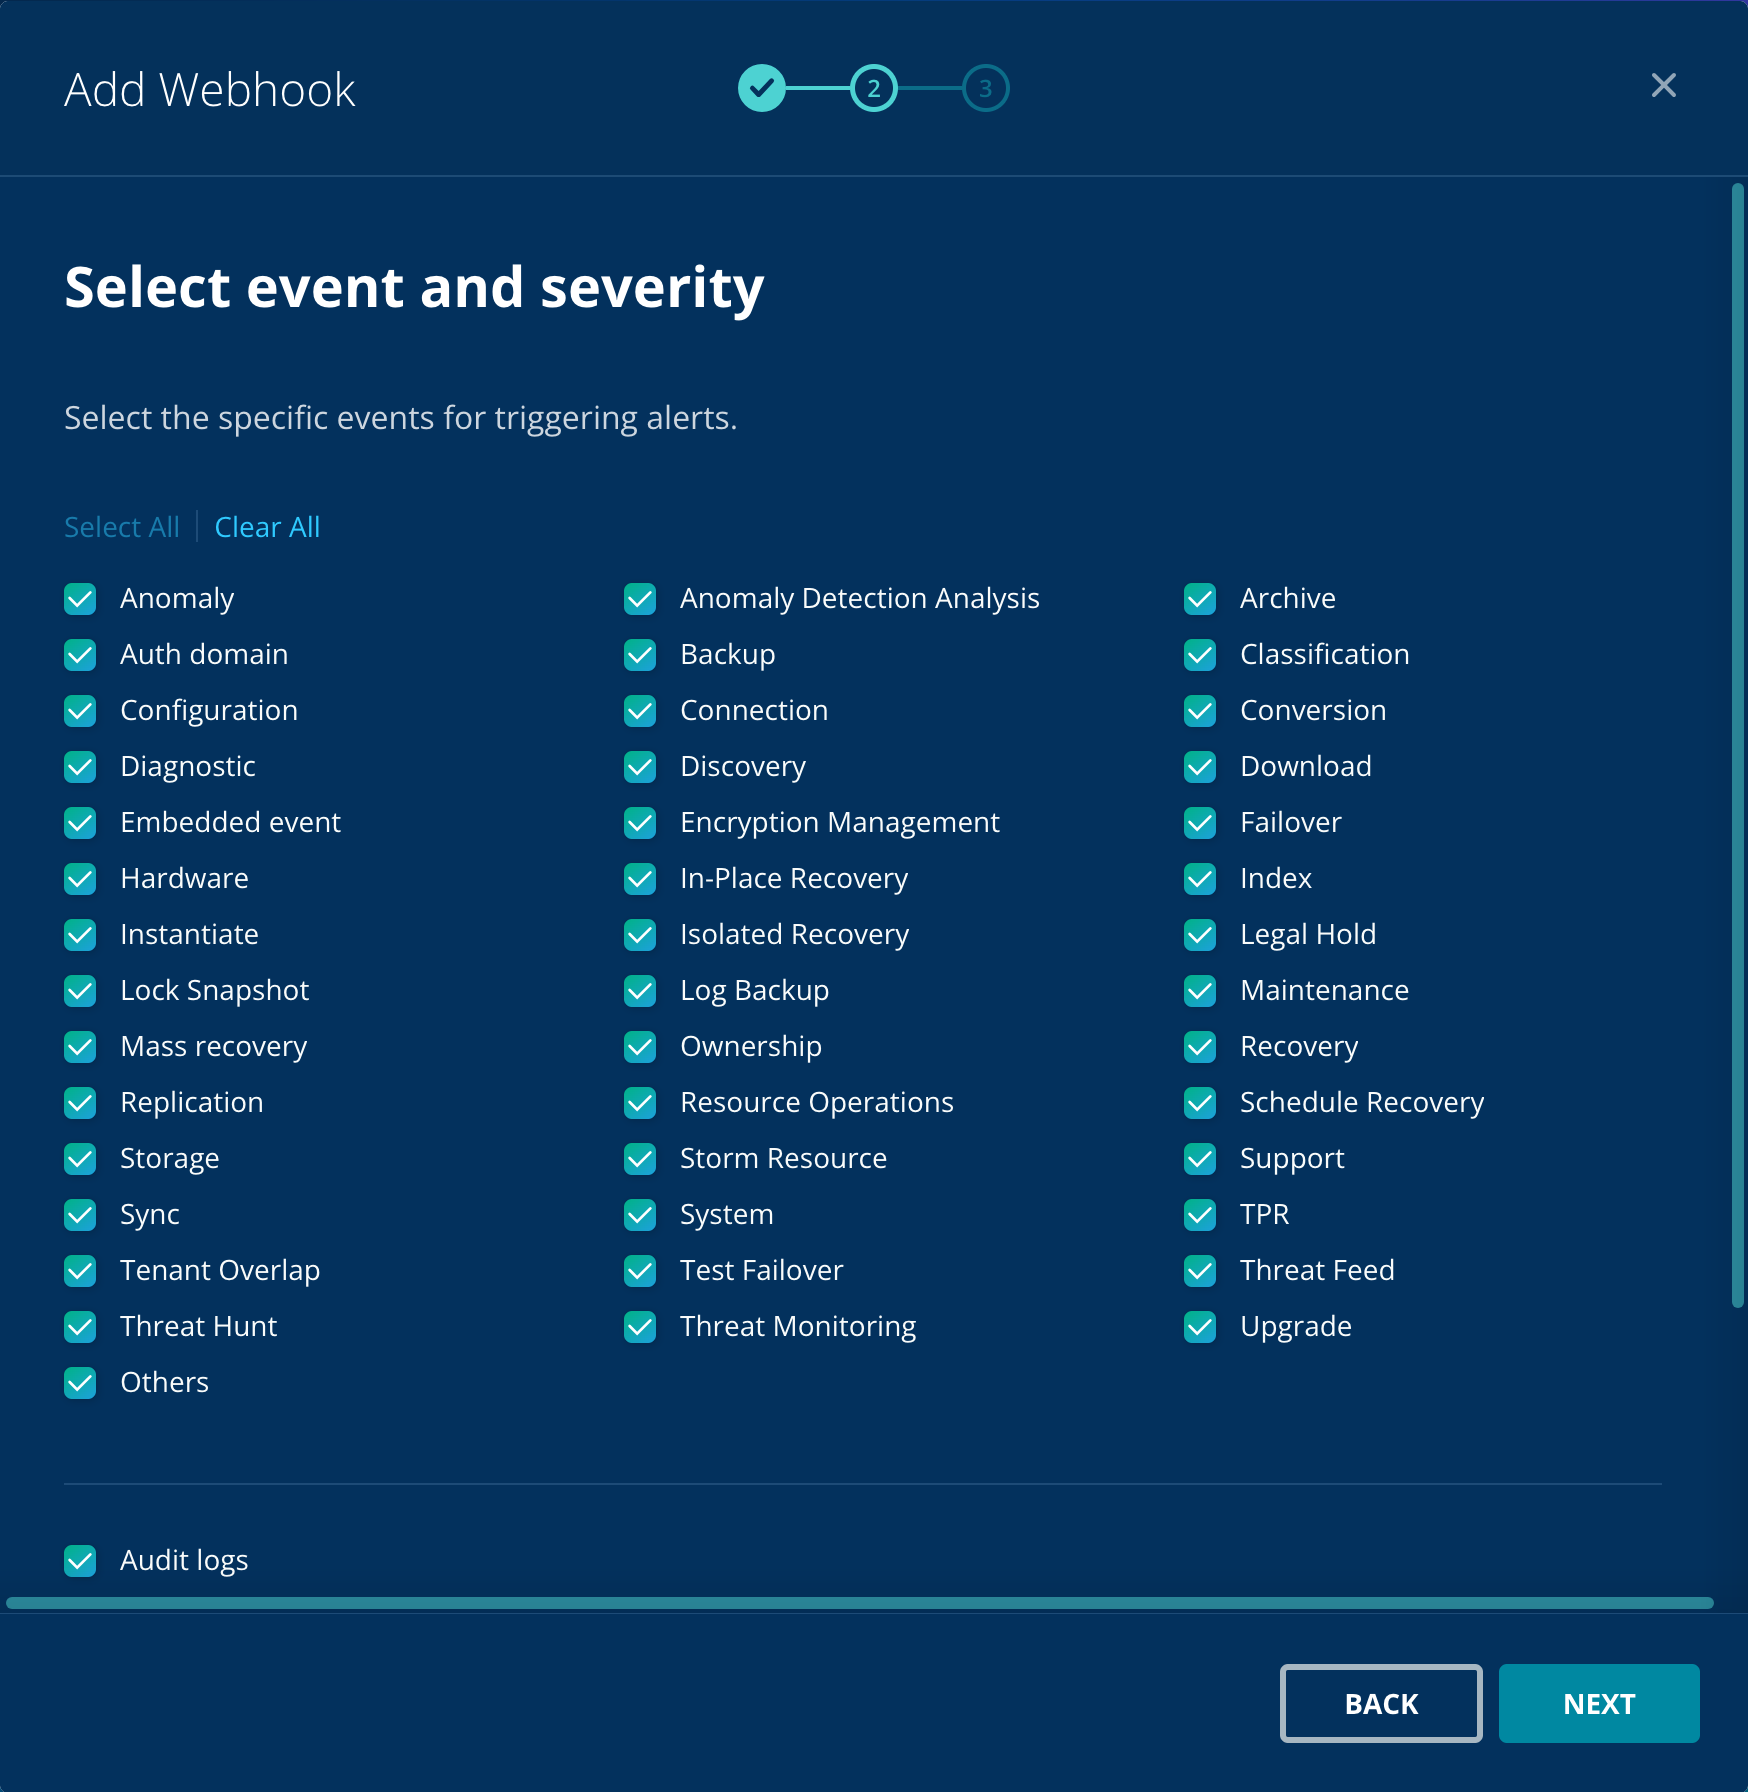
Figure 64. Webhook
Click .
Click .
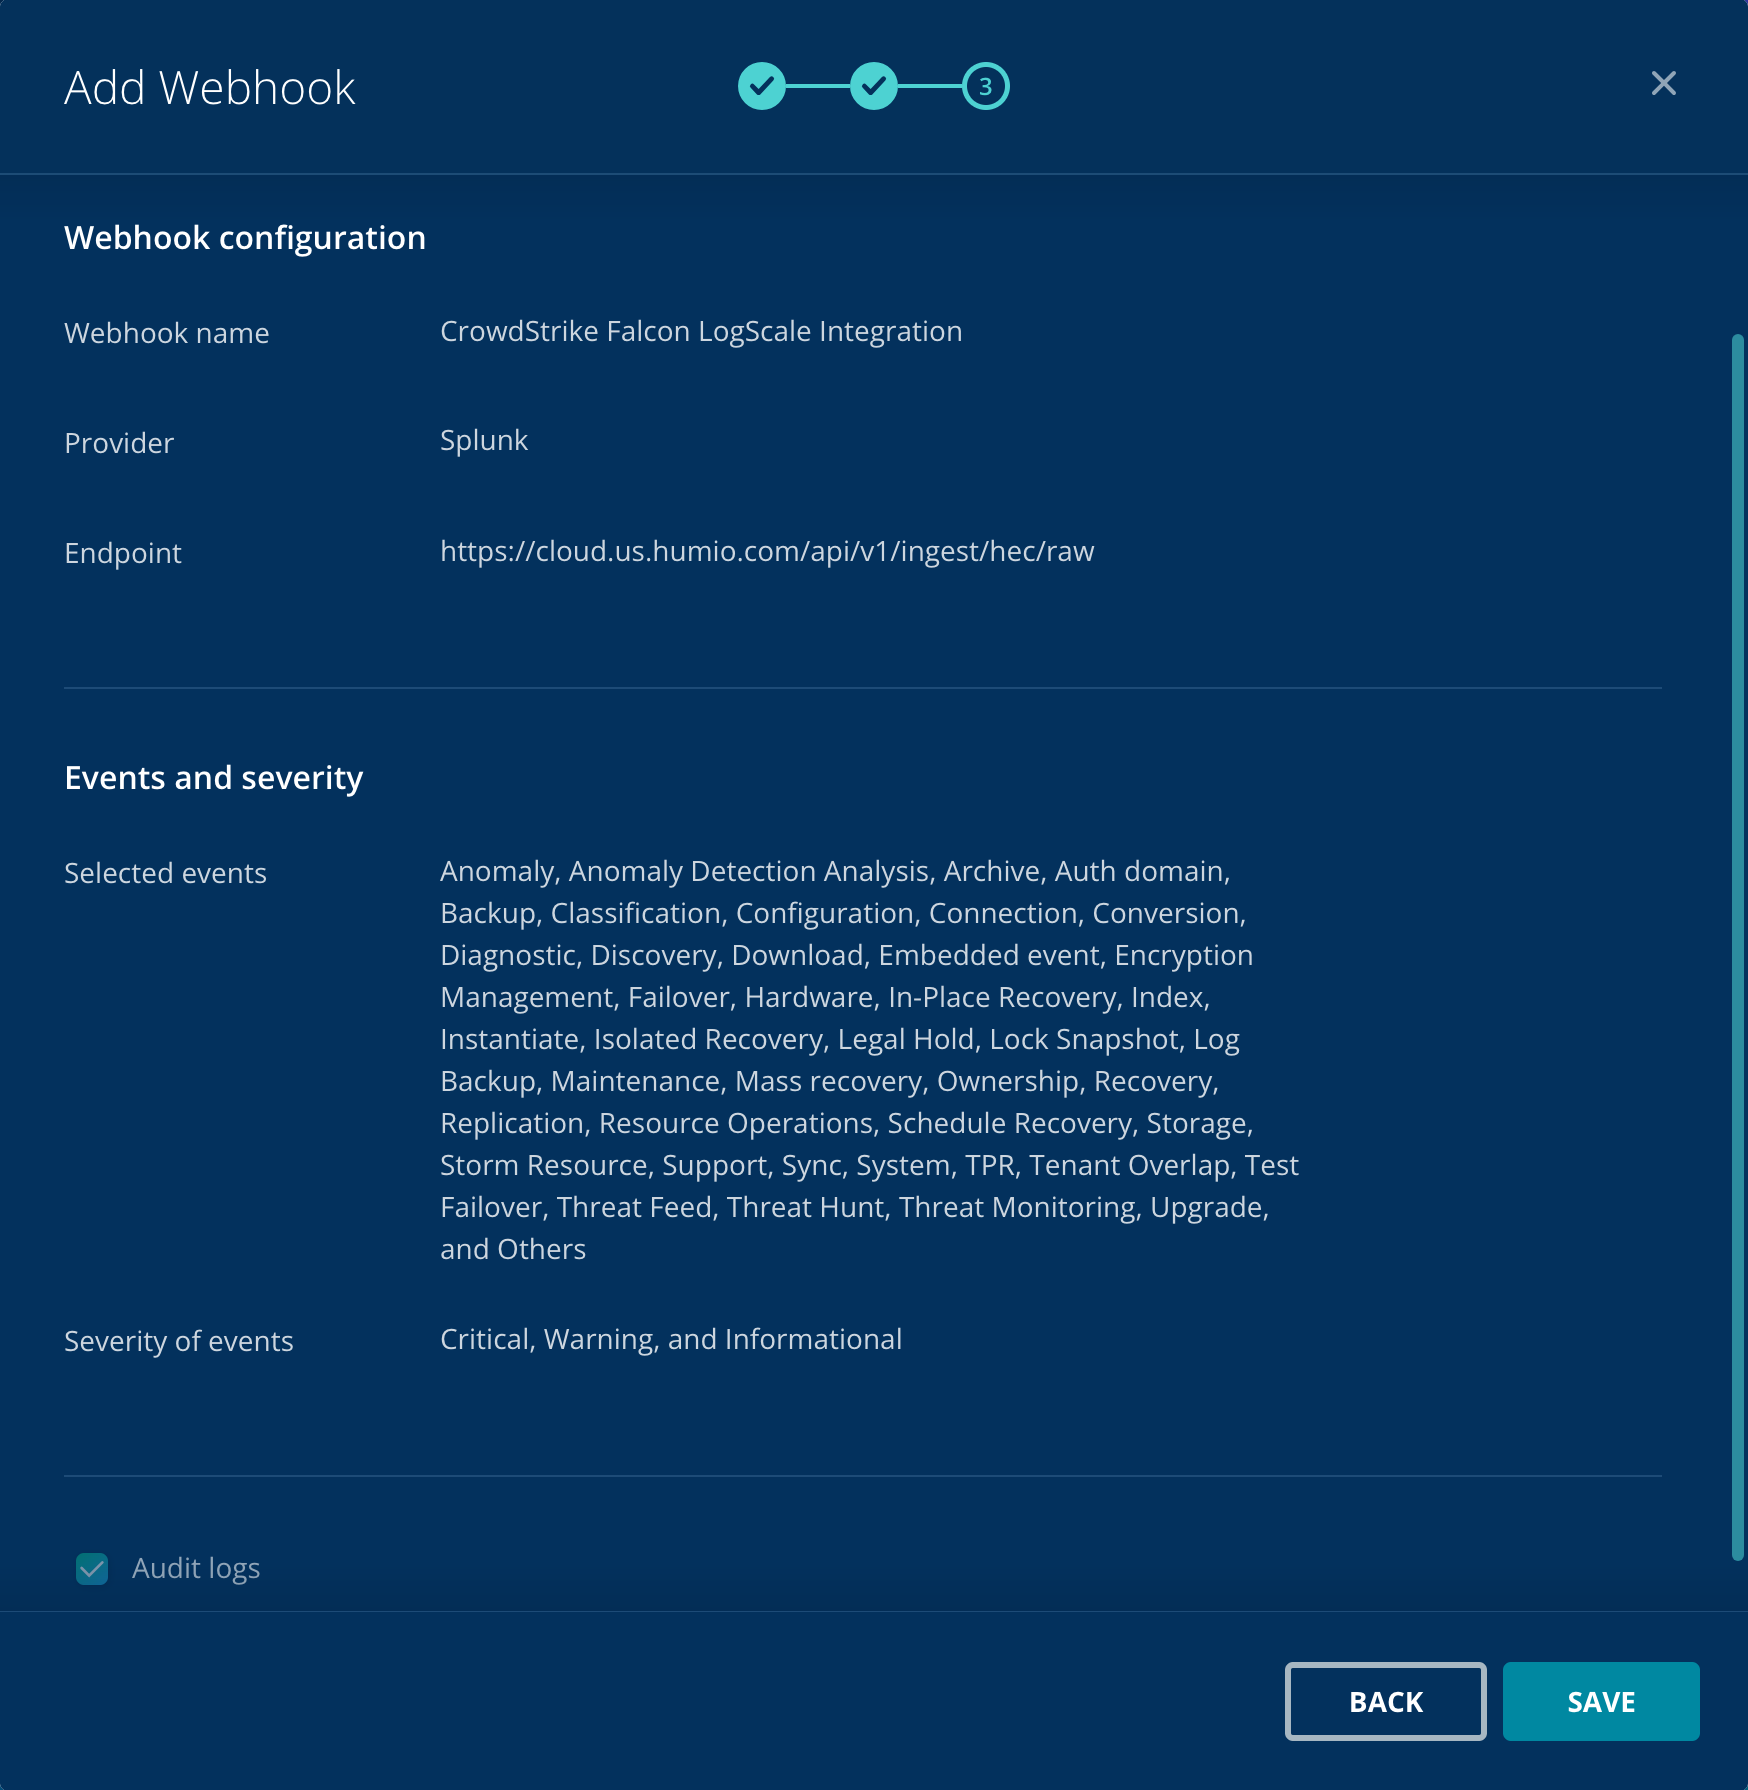
Figure 65. Webhook
Verify Data is Arriving in LogScale
Once you have completed the above steps the Rubrik Security Cloud data should be arriving in your LogScale repository.
You can verify this by doing a simple search to see the events:
#Vendor = "rubrik"
| event.module="security-cloud"
Package Contents Explained
This package contains the following parsers, queries and dashboards:
Dashboards:RubrikSecurityCloud
Parser:Rubrik-json
Queries:
RubrikUserAccessAndManagement
- RubrikThreatEvents
RubrikOperationalHealth
RubrikBackupSuccessMetricsByDay
RubrikAnomalyEvents
RubrikApplicationsNotProtected
RubrikApplicationsProtected
RubrikBackupSuccessMetricsByType
RubrikSuccessPercentByObjectType
RubrikSuccessPercentByDay
This package parses incoming data, and normalizing the data as part of that parsing. The parser normalizes the data to CrowdStrike Parsing Standard (CPS) 1.0 schema based on OpenTelemetry standards, while still preserving the original data.
If you want to search using the original field names and values, you can access those in the fields whose names are prefixed with the word Vendor. Fields which are not prefixed with Vendor are standard fields which are either based on the schema (e.g. source.ip) or on LogScale conventions (e.g. @rawstring).
The fields which the parser currently maps the data to, are chosen based on what seems the most relevant, and will potentially be expanded in the future. But the parser won't necessarily normalize every field that has potential to be normalized.
Event Categorisation
As part of the schema, events are categorized by fields:
event.outcome
For example, the following will find events where some
event.type[n] field contains the value
network, regardless of what
n is.
Note that not all events will be categorized to this level of detail.
Normalized Fields
Here are some of the normalized fields which are being set by this parser:
event.* (e.g. event.id, event.module, event.action, event.severity )
ecs* (e.g. ecs.version )
Cps* (e.g. Cps.version )
user.* (e.g. user.name, user.id)