
Managing Dashboards
Security Requirements and Controls
Change IP filterspermissionChange dashboardspermissionChange shared dashboard URLspermissionData read accesspermissionDashboard Security policysecurity policy
When using an existing dashboard within your LogScale instance, you can choose to navigate around the dashboard view, change, share and alter the dashboard, and configure the dashboard access.
Access Existing Dashboards
If you need to access previously created dashboards to consult them or edit them, first check your permissions: you might not have the permissions to some of the repositories or views containing those dashboards.
To access existing dashboards across all repositories and views:
Click the tab from the top menu bar to get the full list of existing dashboards: for example, one entry in the list could be humio-metrics / Errors where
humio-metricsis the name of the repository and Errors is the dashboard name within that repository.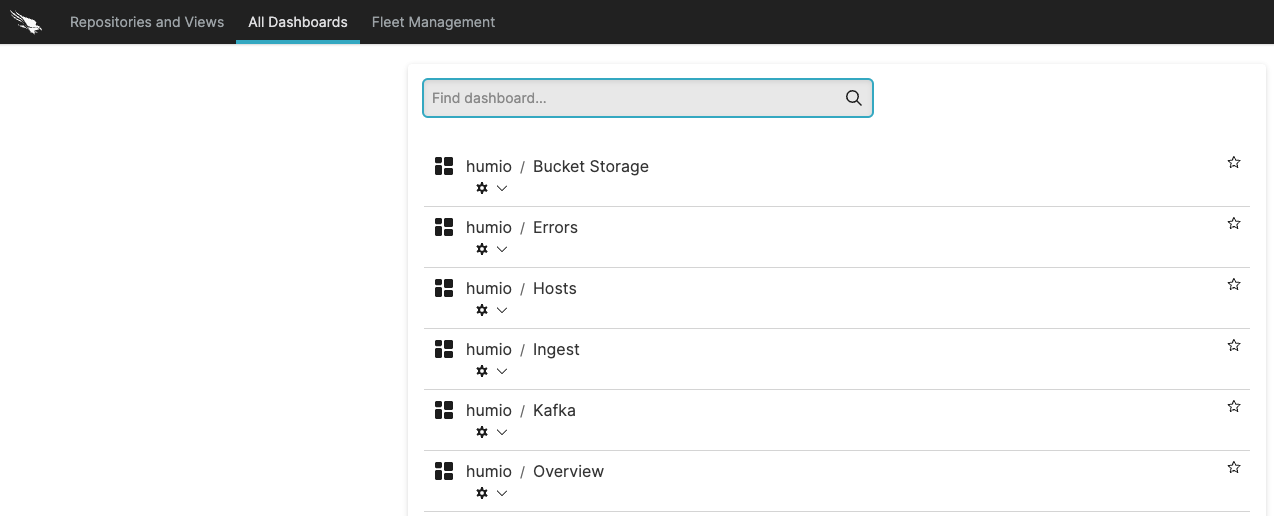
Figure 119. Access Existing Dashboards
Select the desired dashboard by clicking the title after the slash: the dashboard and all its widgets will load (clicking the first item instead redirects you to the tab in that repository).
Tip
Click the star icon next to a dashboard to save it as favorite: it will go on top of the list for quicker access and will appear under Starred Dashboards in the main User Interface.
Main Operations
Click the three-dot menu ⋮ on the upper right corner of a dashboard to perform the following operations:
— allows to share read-only dashboards. See Sharing Dashboards section below for more details.
— creates an identical dashboard. You are prompted to provide:
Dashboard Name is the name you assign to the copied dashboard.
Target Repository or View is the repository or view where you want to store your copied dashboard.
— allows you to export the dashboard in PDF with several print options such as add the dashboard title in the header or the time window it was executed, set it as portrait or landscape, etc.
For more information, see Exporting Dashboards as PDF.
— allows you to change the name of the existing dashboard.
— allows you to create a template from the current dashboard, which you may reuse for new empty dashboards, as explained in Creating Dashboards and Widgets.
— deletes the dashboard and all associated widgets. Removal of a dashboard cannot be undone. To create a backup of the dashboard, consider using the option to keep a copy of the dashboard and its configuration.
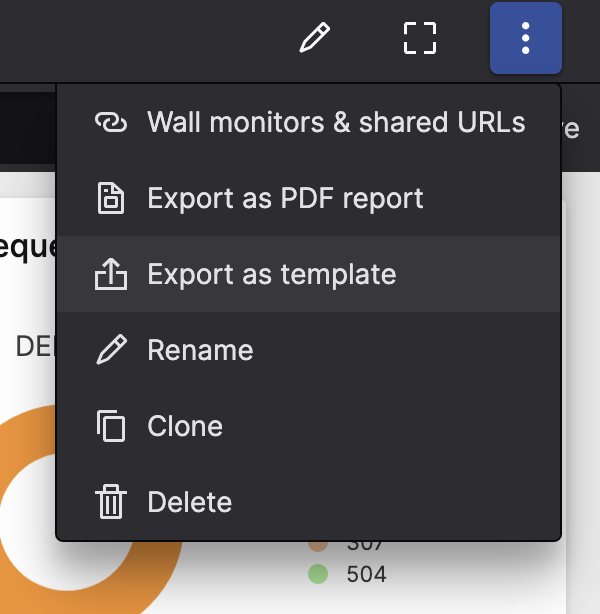 |
Figure 120. Dashboard Options
The same dropdown menu is also available by clicking the cog icon in the list of all dashboards (see Figure 119, “Access Existing Dashboards”) or through the three-dot menu ⋮ next to each dashboard in a given repository, see Figure 114, “Dashboards Tab”.
Sharing Dashboards
Dashboards can be shared using a unique URL. Dashboards shared in this way are read only and can be used to share the dashboard with others, or when using the dashboard as part of a wall monitor. A shared dashboard does not need to authenticate and does not rely on sessions as users do, so sharing should be done with care as everyone with the link will be able to see the dashboard (if an IP filter is set, users need to be within the IP range).
To share dashboards in this way:
Access the dropdown menu in the Query Editor.
A dialog box will open — enter a name in the Link Name field.
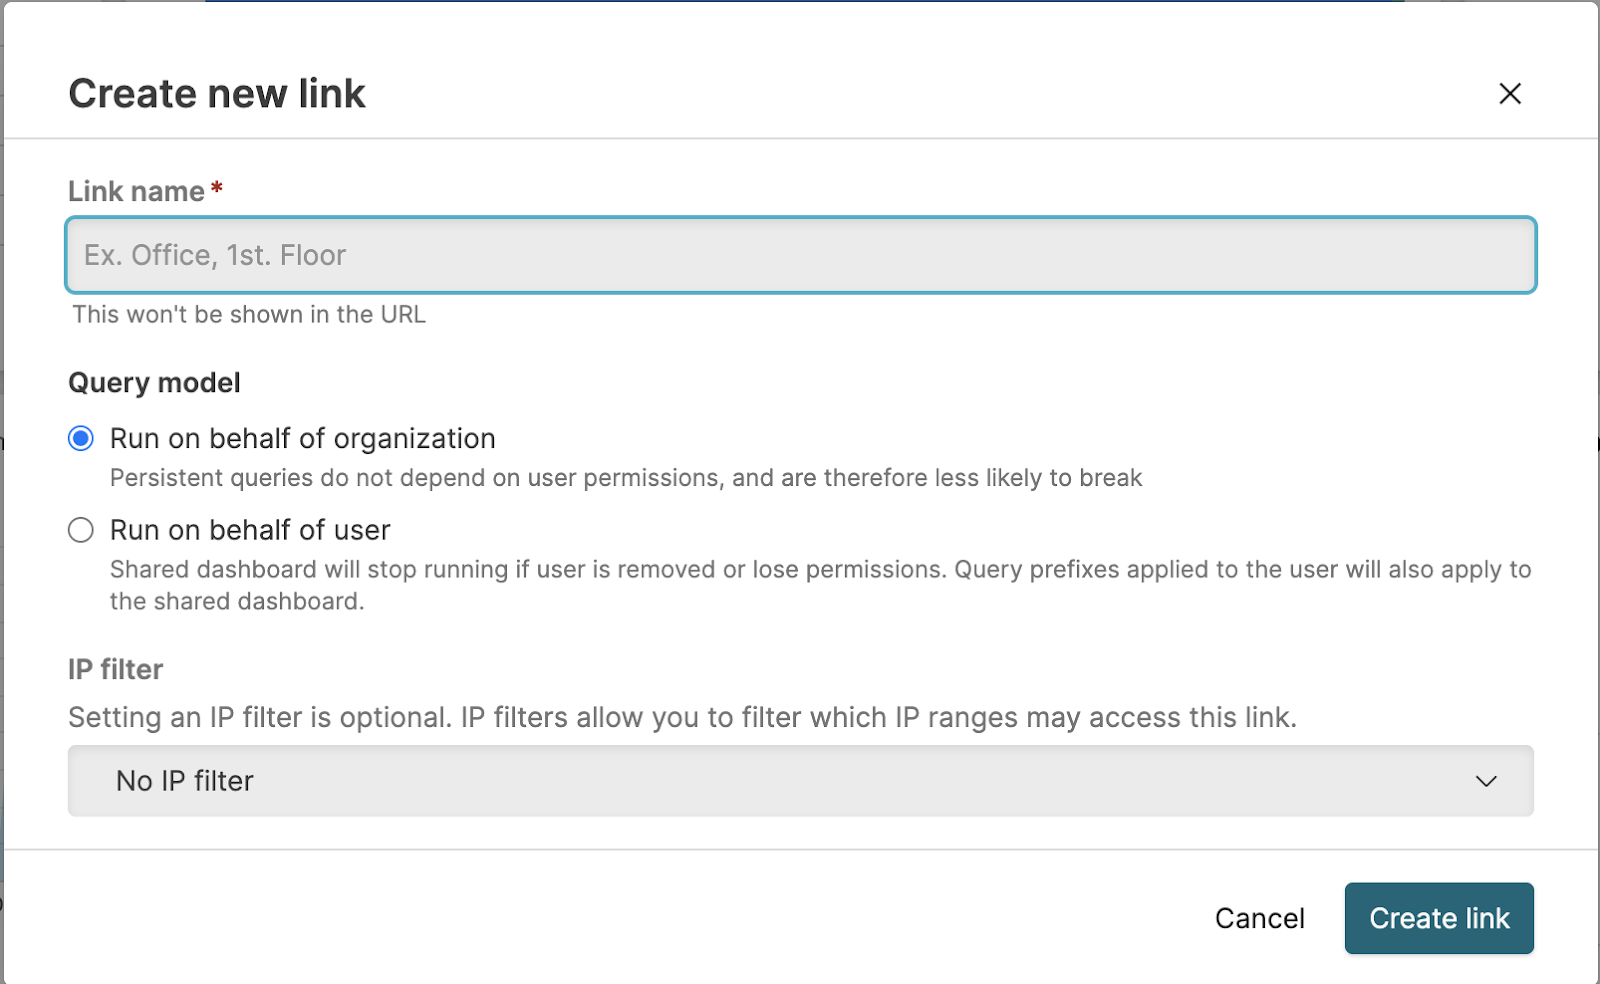
Queries run by the dashboard can either be executed on behalf of the organization or on behalf of the user who created the shared dashboard. For more information, see Organization Owned Queries.
If the Dashboard Security Policies has not enforced an organization-wide IP filter, an optional IP filter can be selected. If the security policy enforces an IP filter, you will see the IP filter next to the Active dashboard URL. See IP Filters.