When using an existing dashboard within your LogScale instance, you can
choose to navigate around the dashboard view, change, share and alter the
dashboard, and configure the dashboard access.
Access Existing Dashboards
If you need to access previously created dashboards to consult them or
edit them, first check your permissions: you might not have the
permissions to some of the repositories or views containing those
dashboards.
To access existing dashboards across all repositories and views:
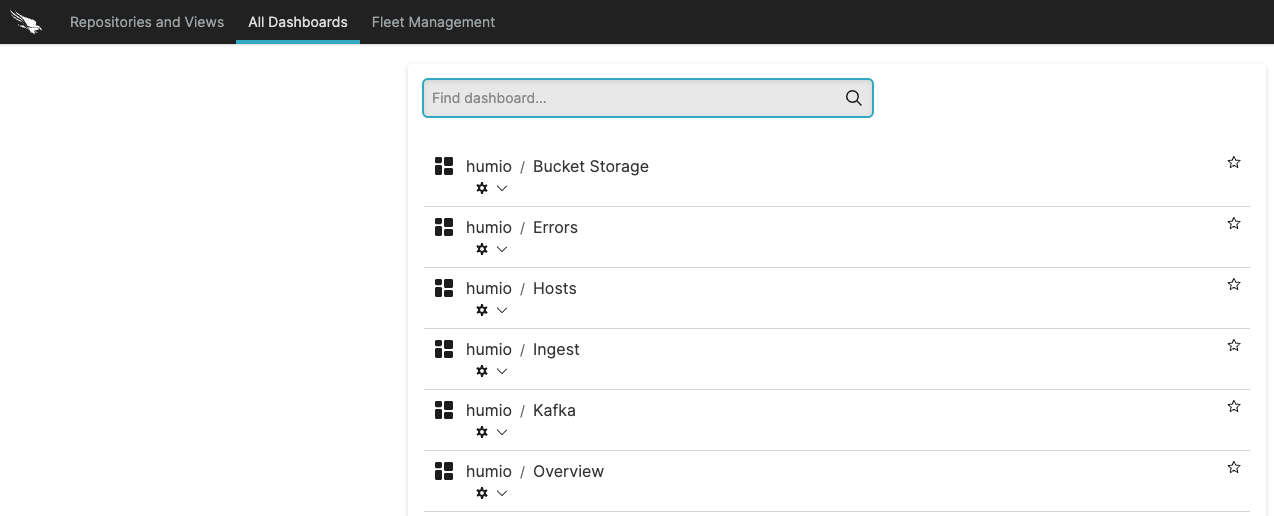
Click the tab
from the top menu bar to get the full list of existing dashboards:
for example, one entry in the list could be
humio-metrics / Errors where
humio-metrics is the name of
the repository and Errors is
the dashboard name within that repository.
Select the desired dashboard by clicking the title after the slash:
the dashboard and all its widgets will load (clicking the first item
instead redirects you to the
tab in that
repository).
Tip
Click the star icon next to a dashboard to save it as favorite: it
will go on top of the list for quicker access and will appear under
Starred Dashboards in the main User Interface.
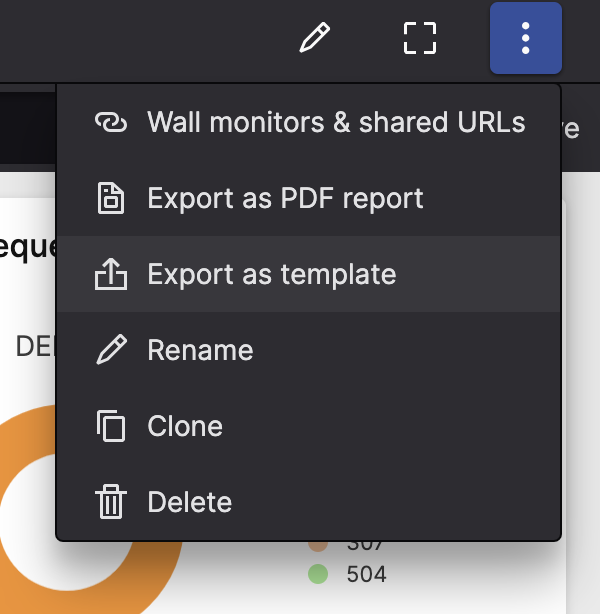
Click the three-dot menu ⋮
on the upper right corner of a dashboard to perform the following
operations:
— allows to share read-only dashboards. See
Sharing Dashboards section below for more
details.
—
creates an identical dashboard. You are prompted to provide:
— allows
you to change the name of the existing dashboard.
— allows you to create a template from the current dashboard,
which you may reuse for new empty dashboards, as explained in
Create Dashboards and Widgets.
— deletes
the dashboard and all associated widgets. Removal of a dashboard
cannot be undone. To create a backup of the dashboard, consider
using the option to keep a copy of the dashboard and
its configuration.
The same dropdown menu is also available by clicking the cog icon in the
list of all dashboards (see
Figure 104, “Access Existing Dashboards”) or through the
three-dot menu ⋮ next to
each dashboard in a given repository, see
Figure 99, “Dashboards Tab”.
Dashboards can be shared using a unique URL. Dashboards shared in this
way are read only and can be used to share the dashboard with others, or
when using the dashboard as part of a wall monitor. A shared dashboard
does not need to authenticate and does not rely on sessions as users do,
so sharing should be done with care as everyone with the link will be
able to see the dashboard (if an IP filter is set, users need to be
within the IP range).
To share dashboards in this way:
Access the dropdown menu in the Query Editor.
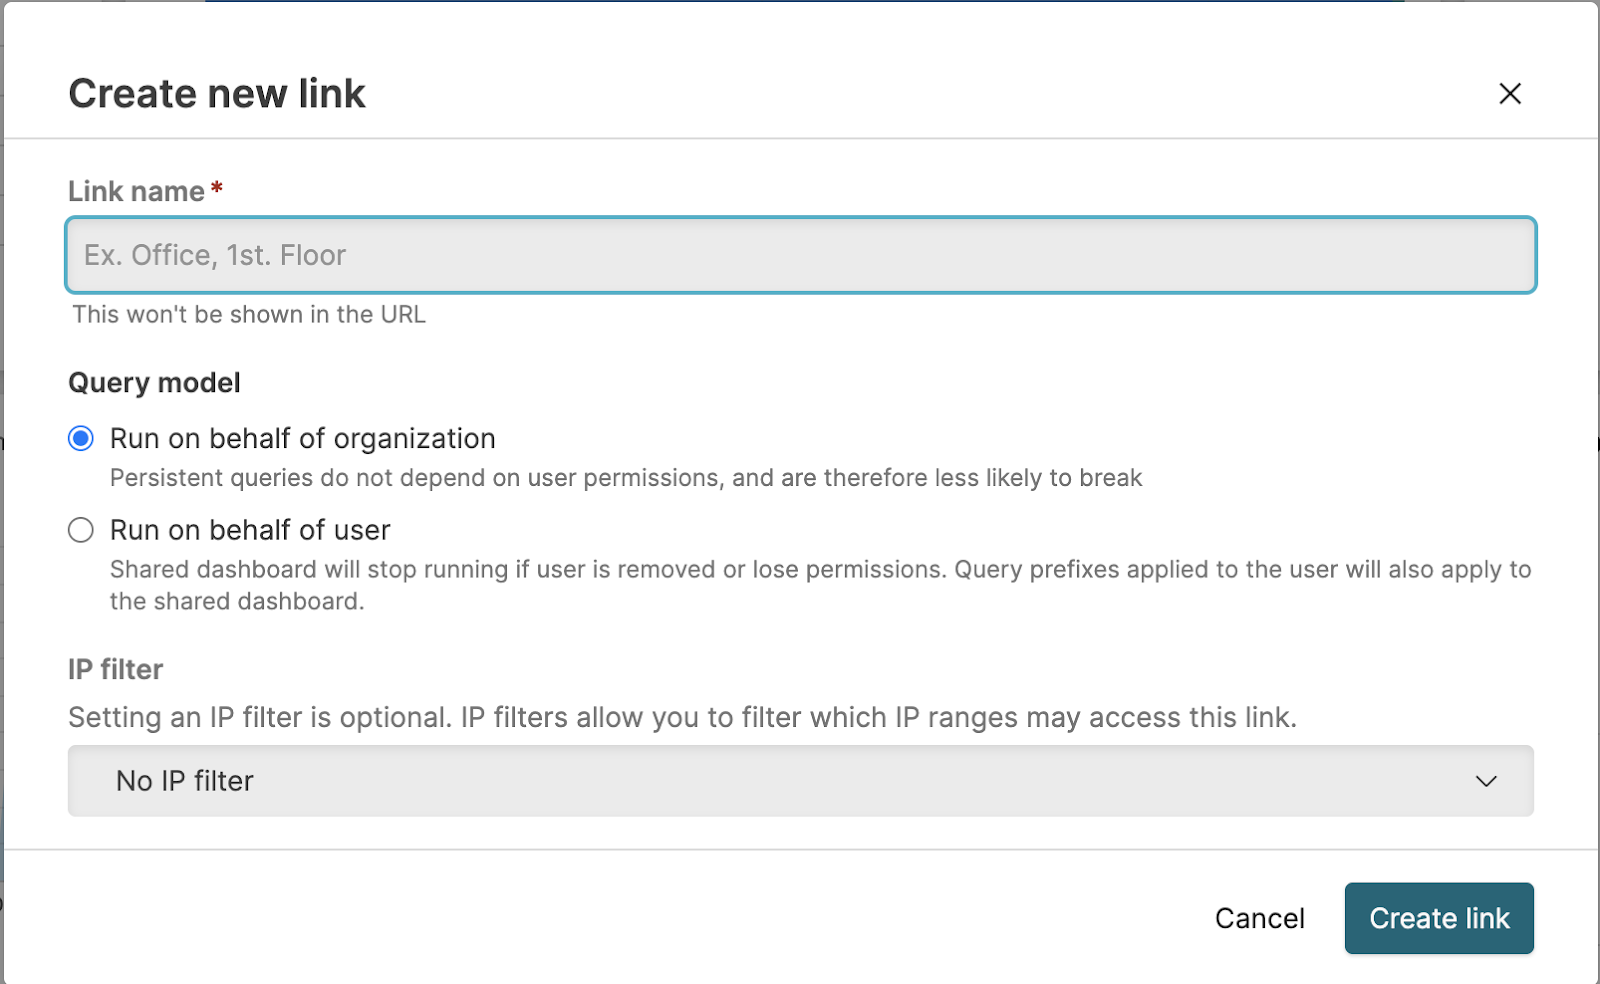
A dialog box will open — enter a name in the Link
Name field.
Queries run by the dashboard can either be executed on behalf of the
organization or on behalf of the user who created the shared
dashboard. For more information, see
Organization Owned Queries.
If the Dashboard security policies has not
enforced an organization-wide IP filter, an optional IP filter can
be selected. If the security policy enforces an IP filter, you will
see the IP filter next to the Active dashboard URL. See
IP Filters.
Disabling Access to Shared Dashboards
Because shared dashboards are accessible to anyone who has a link to
them, there is a risk of unwanted information disclosure; therefore,
in some cases you might want to prevent certain users from accessing
these dashboards. You can do this in two ways:
Set the variable SHARED_DASHBOARDS_ENABLED
configured to false to keep
dashboards sharing disabled across the entire cluster. This
configuration disables the + Create new
link button.
Disable dashboard sharing via the UI — see
Dashboard security policies for details.
When trying to access a shared dashboard that has been disabled
afterward, two possible cases apply:
Users opened a shared dashboard before it became unavailable,
meaning the dashboard is running — they are presented with
an error and the dashboard changes status to reflect this.
Furthermore, if access to that dashboard is re-enabled, it will
come back for these users, without any manual intervention needed.
Users attempt to open a link to a shared dashboard after it became
unavailable — they do not get any error message and it will
look like it isn't a real dashboard. If the dashboard is
re-enabled, these users will need to manually refresh the page to
see the dashboard.
Restricting Access with IP Filters
Once you have created read-only dashboards with the option
, you can restrict their access to certain IP
addresses only.
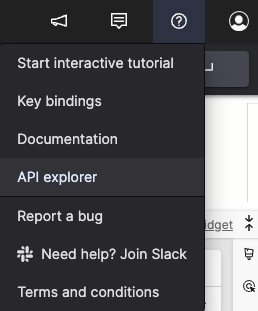
One way to do it is setting the IP filters with the GraphQL interface.
From the User Interface, click on the circled question mark near
the top right and select :
In the panel that pops up, enter a mutation like so:
mutation {
  updateReadonlyDashboardIPFilter(ipFilter: "allow 5.94.131.141; deny all")
}
In this example, only one IP address is allowed access and all
others are denied access to any read-only dashboards.
Click the right arrow-head button to execute it. The results will
appear in the panel to the right:
To change an IP filter, execute the mutation again with the corrected
or added values. This will replace the previous IP filters. Or, you
can add multiple IP filters by separating them with a semi-colon.
Alternatively, you can set IP filters for read-only dashboards from
the User Interface instead of having to use the GraphQL:


