
Editing Dashboards
Security Requirements and Controls
Change dashboardspermission
Dashboards are managed from the three small icons on the top right, which allow you to perform these actions:
Edit dashboard — enters the dashboard's editing mode. For details see next section Working in Edit Mode.
Toggle full screen — gives more space to the dashboard area by entering in full-screen mode.
Open dropdown — opens the menu that allows to perform several operations with the dashboard. See Main Operations for more details.
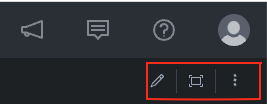 |
Figure 125. Manage Dashboards
Working in Edit Mode
Once a few widgets have been created in a dashboard, you may want to make some changes as to how it's organized, how it's labeled, and what time frame it covers.
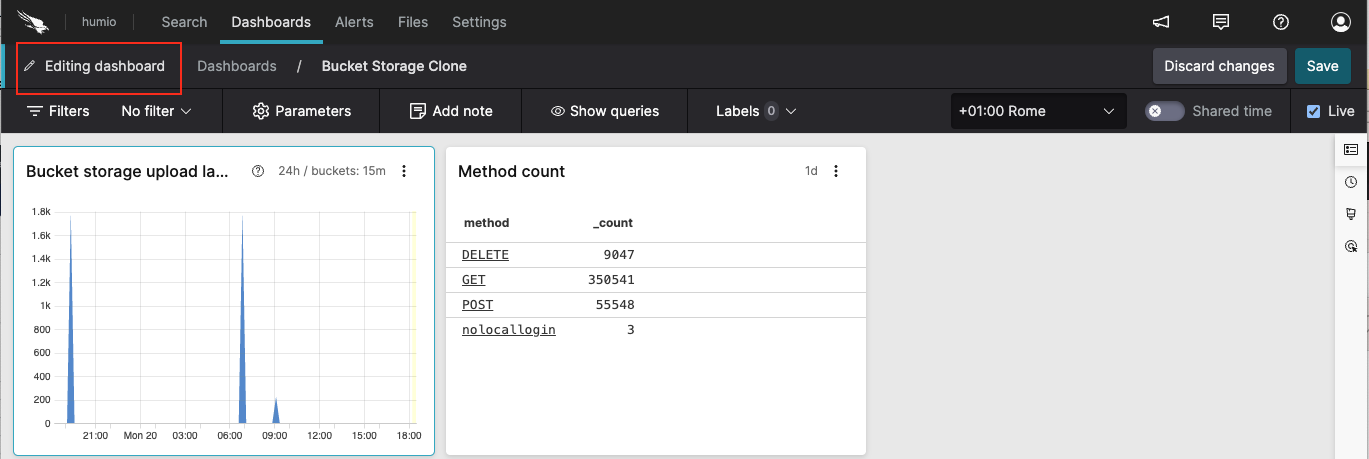 |
Figure 126. Dashboard Edit Mode
Click the pencil icon on the top right to enter Editing Dashboard mode: this allows you to resize your widget, or drag and move it next to other widgets in the dashboard.
Select one the icons on the right-hand menu e.g. Dashboard:
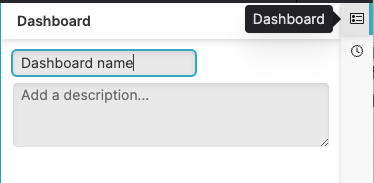
Figure 127. Dashboards Edit Icons
and change the following as required.
Dashboard is used to set:
Name — you can change the name of the dashboard.
Description — define, remove or change the description.
Time is used to set:
Default Time Settings — shows the current time selection. Click if you want to update the default time settings to match the time and liveness that is currently shown. The Time Selector field will show such default interval. See Time Interval Settings for more information on time settings.
Time Selector Arrows — click to customize the skip interval used when moving the interval earlier or later in time with the and buttons. Click to use the default skip interval.
Time skip — field to enter the customized jump size (in milliseconds).
Once you are happy with editing the dashboards and widgets click , otherwise .
When in edit mode, you can also select:
Add Note — adds a Note Widget. Note widgets allow you to use markdown to format the text and add other elements, such as, links to other dashboards and to external web pages, as well as dashboards on external systems.
Show Queries — displays the queries used by each widget and edit the query to meet your needs, or, if the results aren't quite right for a widget, you might want to copy a particular query, switch to the Search page and paste it in the query input box there so that you can try modifying it. You can also click the three dots on the widget and select Edit in Search view, as explained in Managing Widgets.
Labels — adds or edits the labels assigned to a dashboard.
Filters
Filters are a powerful way of reducing data displayed on a dashboard to allow you to look at a subset of your data. Save a filter to quickly jump between different configurations and reuse the dashboard for, e.g., different environments, systems, or customers.
On the top left of the dashboard, click → .
Enter a filter expression in the box: the filter specified here will be prefixed to all queries of all widgets on the dashboard.
Click and .
Typically, you will only use filter expressions like for example:
env=prod or
 in(service, [nginx, mysql])
as opposed to aggregate functions like groupBy()
and timeChart().
Parameters
From the top of the dashboard area, you can also set parameters.
Parameters allow you to filter and modify dashboard results. Using
parameters like for example
?username or
?host or
?{env=staging} in a query will
show an input field on dashboards, and will be read from the URL when
the dashboard loads.
For all the details about parameters and how to configure them in dashboards, see Managing Dashboard Parameters.
Time Interval Settings
You can set the desired time interval and time zone for a dashboard, or make it running live, with the following buttons — they are available from the top right of the dashboard:
Time Zone Selector — assign a temporary timezone to all widgets on the dashboard without going into edit mode. When you change it, the new timezone is displayed e.g.
Europe/Copenhagenand will be also read from the URL when the dashboard loads.Copying and pasting the dashboard URL in another tab keeps the selected timezone.
The new timezone is temporary because logging out/in brings it back to default (your timezone).
You can use the revert icon to reset the timezone to default (see Figure 128, “Time Interval Settings”.)
Time Selector — Only available when Shared time is toggled on, allows to change the time interval for the entire dashboard, and the change will overwrite whatever is already selected in the individual queries/widgets themselves.
Click Shared time to enable it.
Click the small arrow in the Time Selector field: the Time interval dialog pops up.
Select the fixed or relative time range of your choice. For more details on the available time interval options, see Change Time Interval.
Click to confirm your choice.
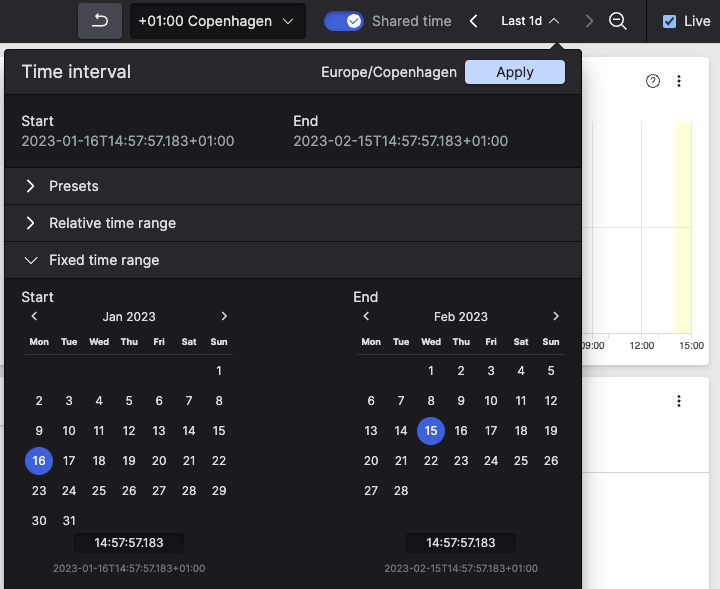
Figure 128. Time Interval Settings
Zoom out — Only available when Shared time is toggled on, the magnifier icon makes the interval of time twice as large e.g., from 5 min to 10 min ago.
Live checkbox — Only enabled when relative time ranges are selected from Shared time, makes the dashboard running live. The live mode applies to either the shared time or the time set in each widget.